


Energies Trading Conditions
| Symbol | Minimum Spread | Average Spread | Pip Value | Min price movement | Contract Value |
|---|
|
|
0.04 | 0.042 | 10.00 | 0.001 | 1000 USD |
|
|
0.038 | 0.039 | 10.00 | 0.001 | 1000 USD |
| Symbol | Minimum Spread | Average Spread | Pip Value | Min price movement | Contract Value |
|---|
|
|
0.03 | 0.033 | 10.00 | 0.001 | 1000 USD |
|
|
0.028 | 0.028 | 10.00 | 0.001 | 1000 USD |
| Symbol | Minimum Spread | Average Spread | Pip Value | Min price movement | Contract Value |
|---|
|
|
0.03 | 0.032 | 10.00 | 0.001 | 1000 USD |
|
|
0.028 | 0.029 | 10.00 | 0.001 | 1000 USD |
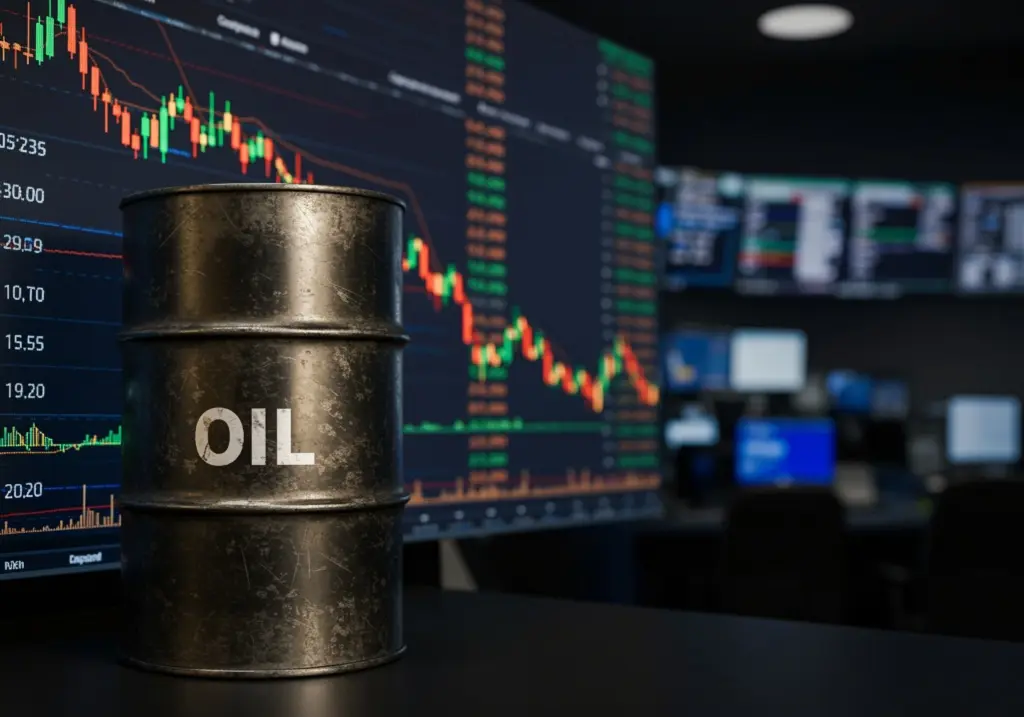
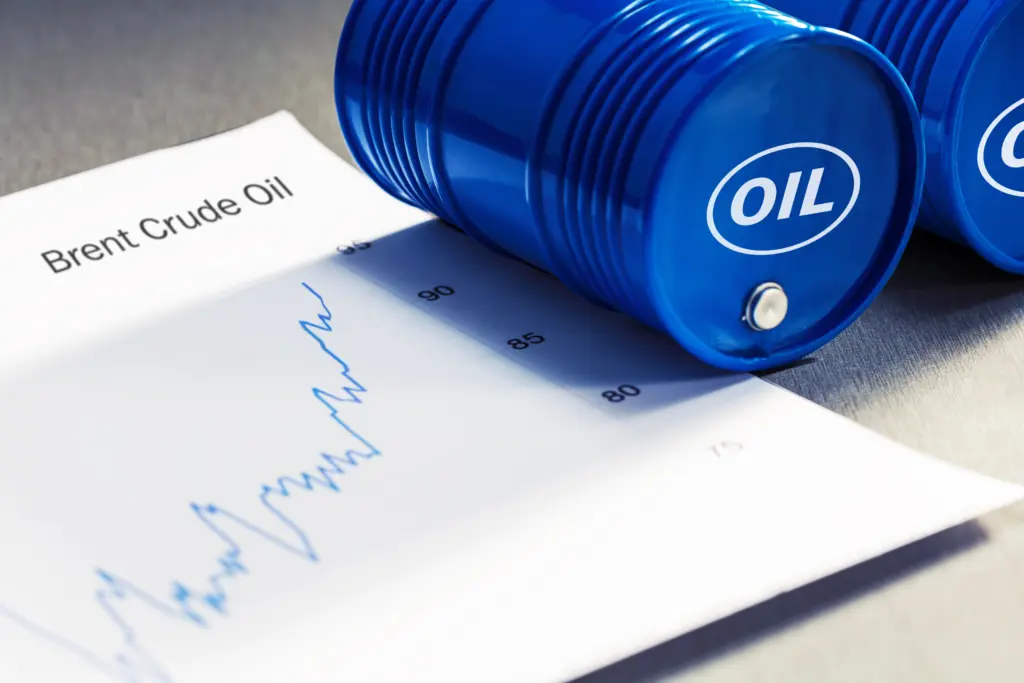
Tap Into The Power Of Energy
Markets!
Energy products like Brent Crude Oil (XBR/USD) and WTI Crude Oil (XTI/USD) are popular commodities that are traded daily 24/5. These represent naturally occurring substances used for energy production and manufacturing.
As essential components of products like gasoline, diesel, plastics, cosmetics, pharmaceuticals, and more, the price of energy commodities exert a huge influence upon the global economy. Such important industries experience a massive amount of trading, creating a high amount of liquidity and frequent price movements, which are perfect conditions for traders to speculate.
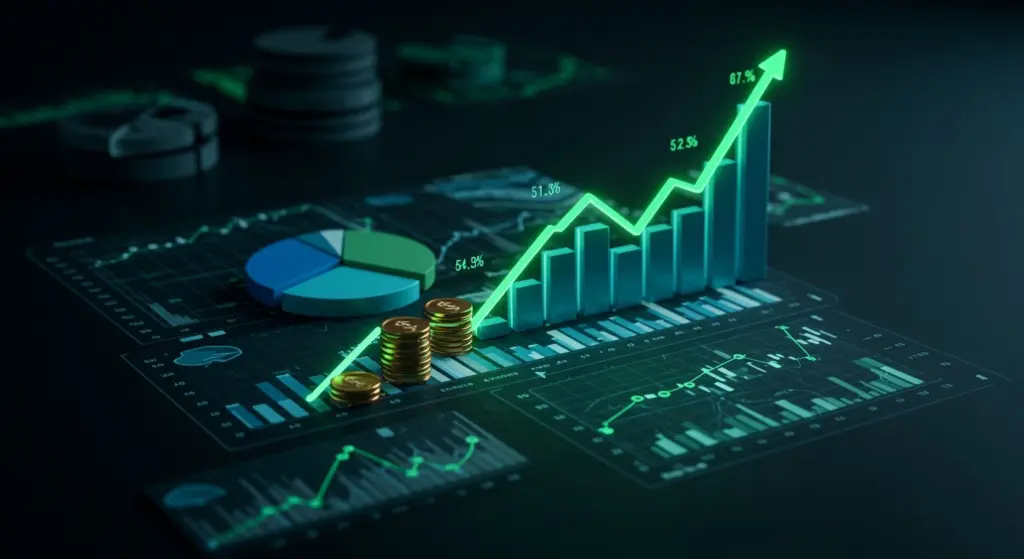
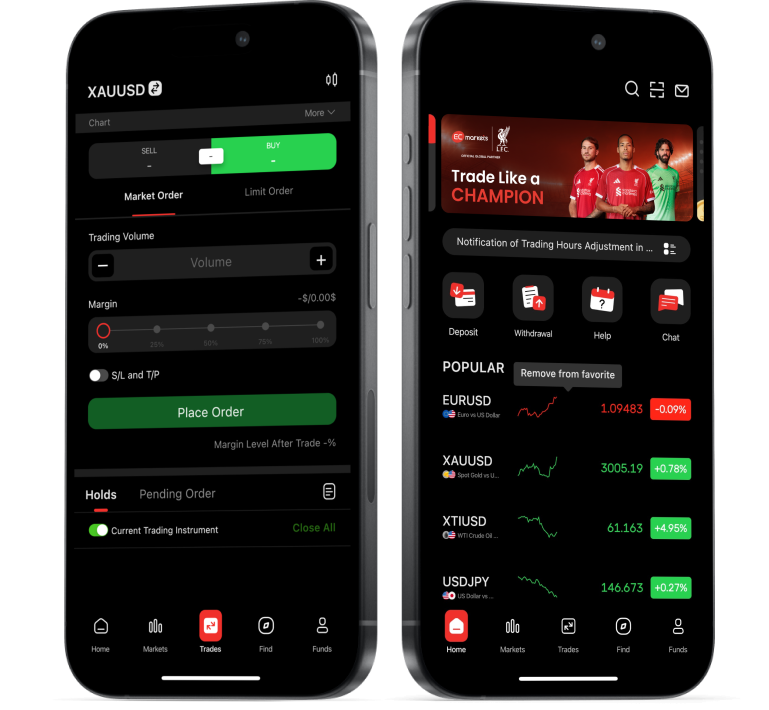
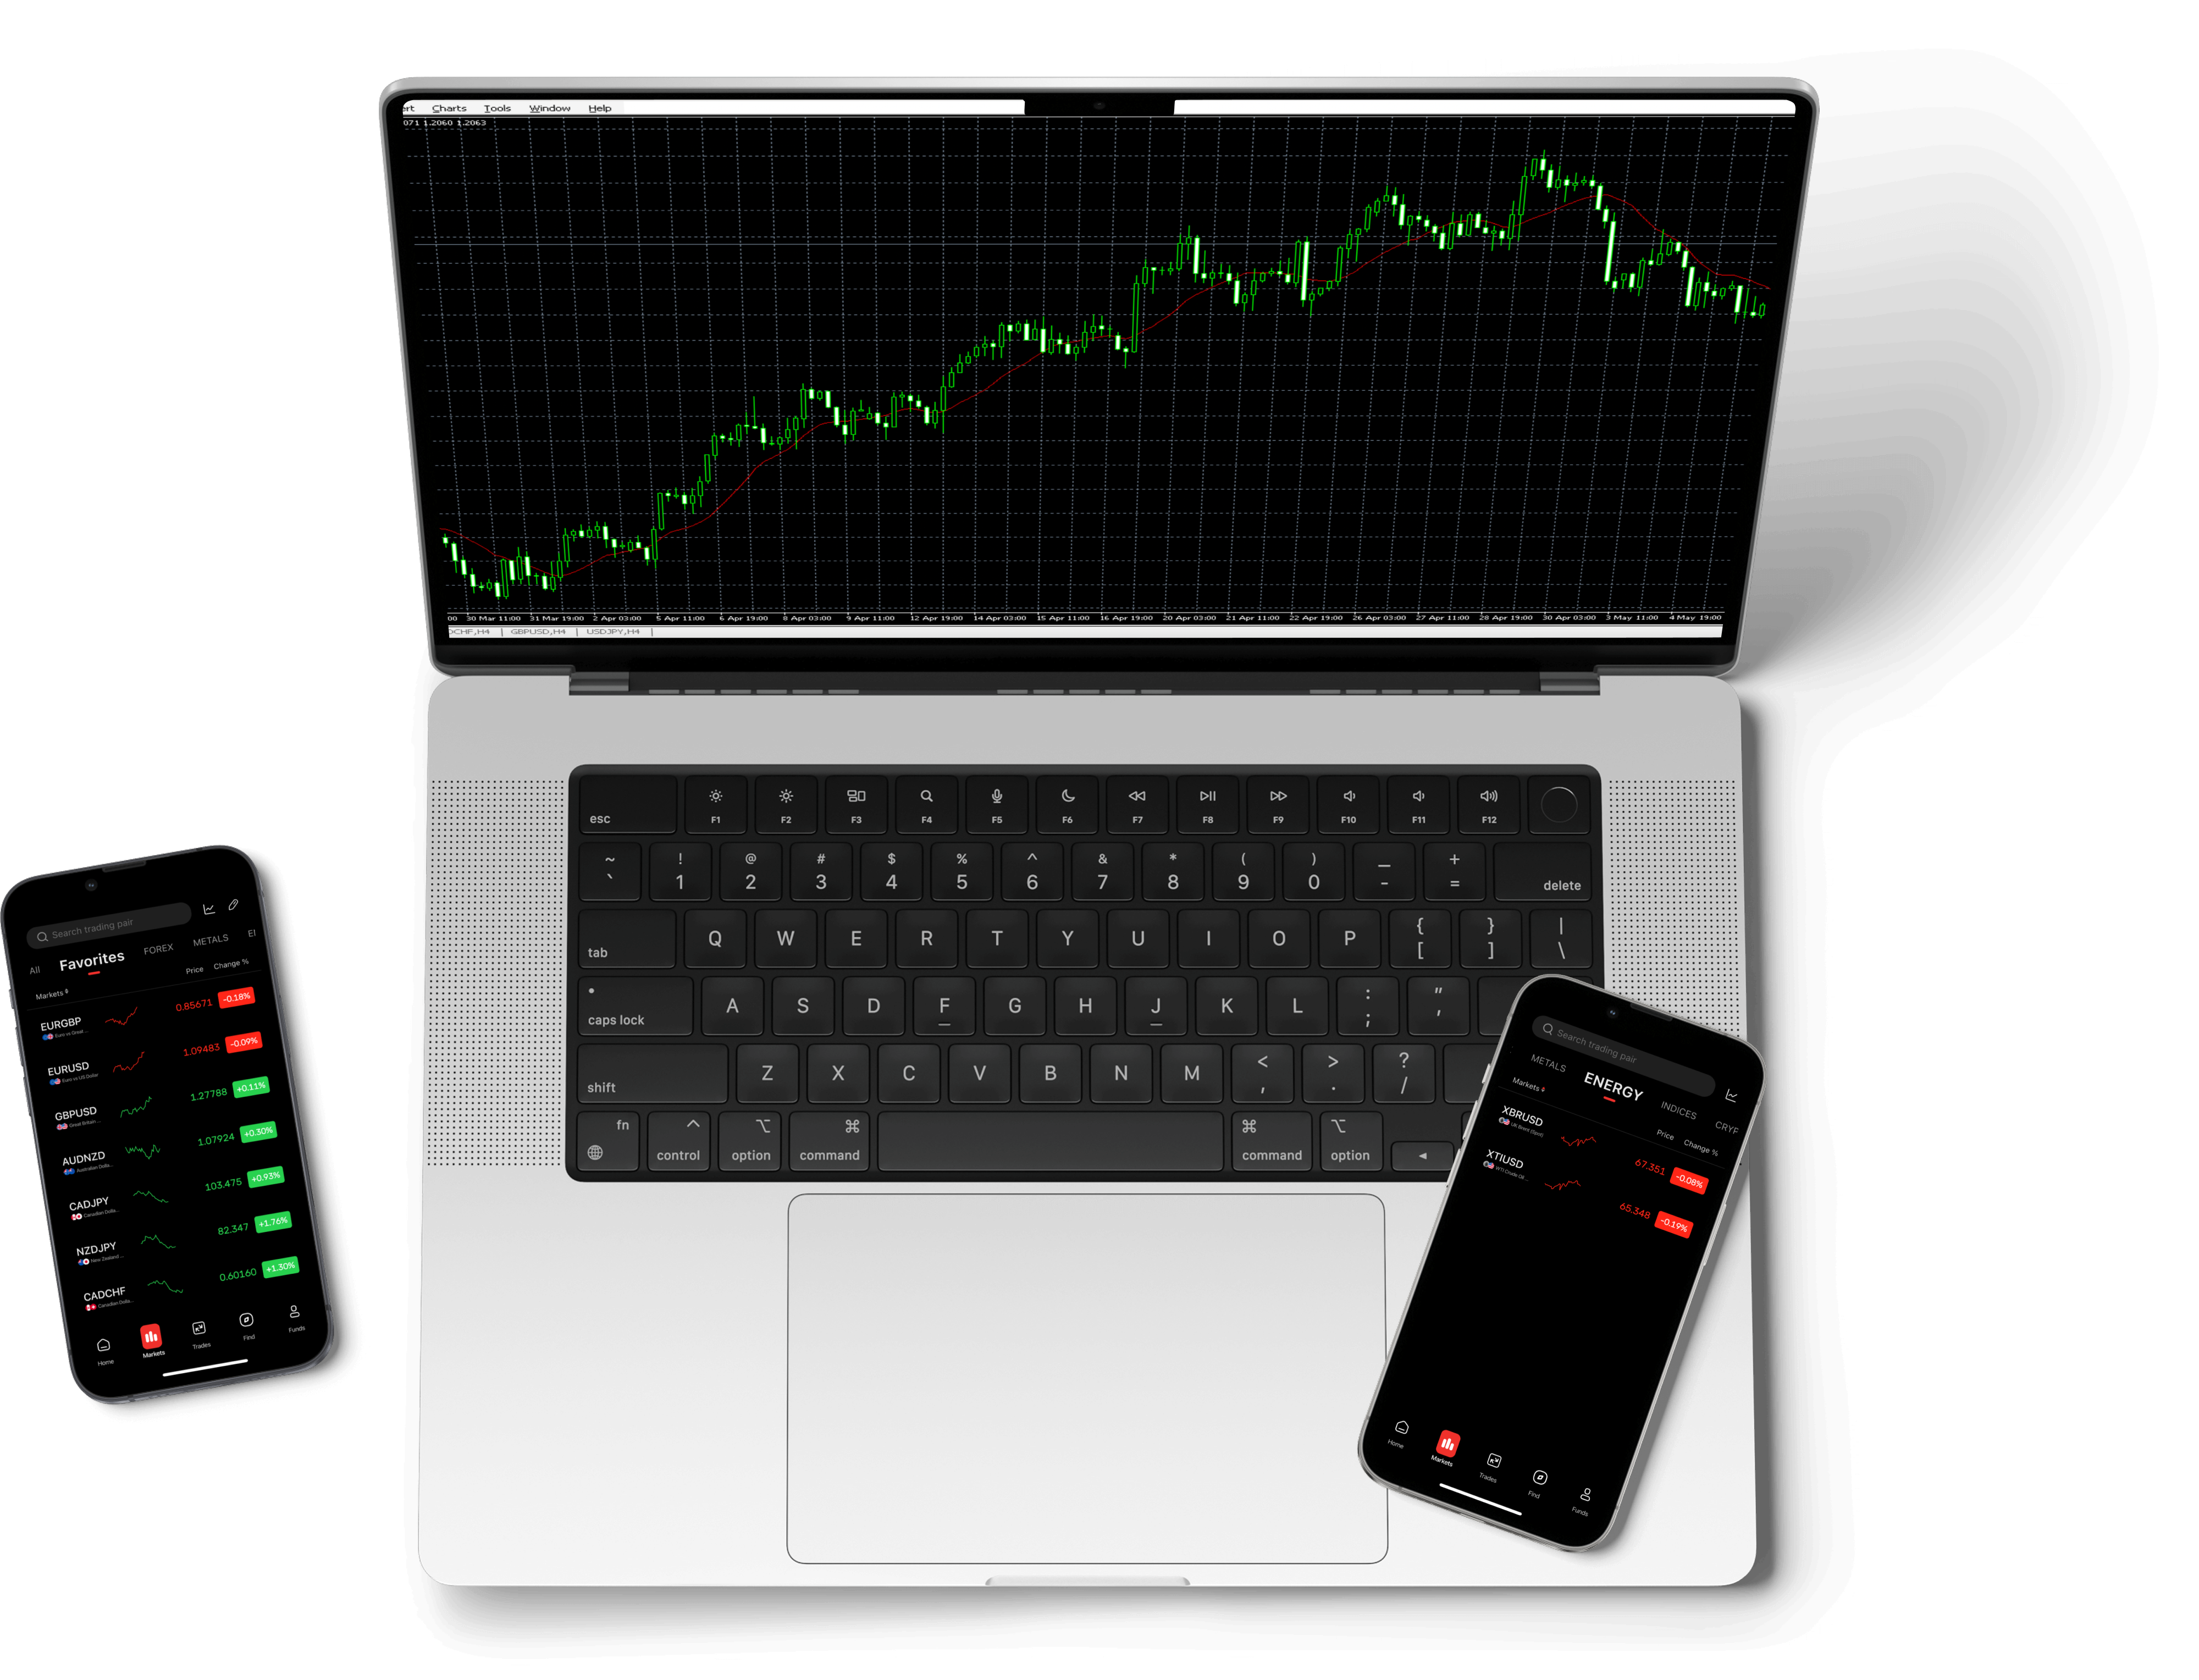
With EC Markets Energy CFDs (Contracts for Difference), you can start trading in the energy markets with speed and flexibility.
Why Trade Energy With EC Markets

Capitalize on Volatility
Energy commodities like crude
oil experience huge amounts of
volatility, which creates profit
opportunities for scrupulous
traders.
Hedge Against Losses
Unmatched global dependence
on oil and other energy products
promotes long term economic
value, enabling traders to
safeguard portfolios.

Harness Global Signals
As the markets for energy
products are heavily influenced
by geopolitics, traders can
utilize geopolitical signals and
news to predict market
movements.

Leverage Macroeconomics
Crude oil prices react strongly
to news about inflation, GDP
growth, and interest rate
changes. Decoding their impact
provides traders with a trading
advantage and profit
opportunities.