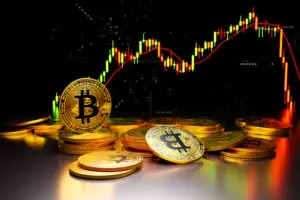
Bitcoin’s latest drop felt like the market hitting a reset button after running too hot. It had just set a record high near $126,198 on October 6, 2025, and then slid into the $66,000 to $68,000 range by mid to late February 2026, which is roughly a 50 percent pullback in a short window. Many outlets compared the retreat to the sharp moves seen after the FTX collapse, especially once Bitcoin slipped below the key $70,000 level.
Bitcoin’s journey through early 2026 has been a story of strong momentum, sudden reversal, and a market now trying to find its footing again. After a powerful move into mid‑January that pushed prices close to $98,000, the trend flipped sharply, leaving many investors wondering what triggered the shift and where things stand today.
What’s a high‑tight flag — in simple terms? It’s when prices sprint higher (that’s the flagpole), then catch their breath in a tight, shallow range near the top (the flag) before trying to push higher again. In practice, you’re looking for a strong run, only a small pullback (roughly 10-25% or less), and signs buyers still have the upper hand.
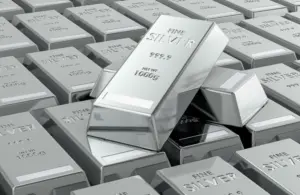
Silver had been trending higher since early September, forming a steady pattern of higher highs and higher lows. That run carried it up toward the January peak (~$120) before momentum turned sharply. Once the structure broke, selling accelerated quickly, taking silver down into the mid‑70s. The speed of the move reflects how silver typically behaves when liquidity thins and positioning unwinds.
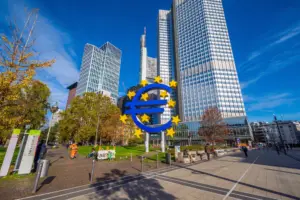
On major decision days, FX charts often appear unusually calm as the market hovers in tight ranges. Then, almost instantly, it turns into chaos. Central bank meetings from the Fed, ECB, or BoE compress a huge amount of macroeconomic expectation into a few minutes of statements, projections, and press-conference remarks. Once released, the market absorbs this information in a single burst, and price action reacts accordingly.