Financial markets move for a reason, and very often that reason is already scheduled on the economic calendar. Interest rate decisions, inflation updates, employment data and growth releases are among the strongest catalysts of volatility across forex, indices, commodities and crypto. The economic calendar brings these events together in one place, giving traders the advantage of preparation rather than surprise. Understanding how to interpret this tool is an essential part of trading with intention and clarity.
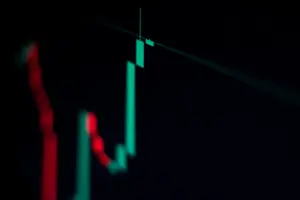
Candlestick charts remain one of the strongest tools available to traders who want to understand the market’s emotional pulse. Beyond showing price levels, they reveal how buyers and sellers behave at key moments and how sentiment shifts over time. In fast‑moving markets, a single candlestick can tell a more powerful story than several paragraphs of news.
Markets rarely move in straight lines, and the dollar’s impact varies year by year; the chart below shows how seasonality plays out across different years.
Super Bowl 2026 is officially in the books. The confetti have fallen, the trophy has been lifted, and once again a familiar Wall Street question surfaces:
Valentine’s Day may be about romance, but it’s also a global economic event. Every February, billions are spent on jewellery, dining, flowers, travel, and gifts. While February 14th isn’t an economic data release in itself, the seasonal surge in consumer spending and sentiment can ripple across commodities, retail sectors, and even currency markets.