














Trendlines Explained: Why Markets Respect Invisible Lines


Trendlines are one of the most widely used tools in technical analysis because they help traders identify the direction of a market and highlight areas where buying or selling interest may emerge. Although they are simple to draw, trendlines can provide valuable insight into trend strength, momentum and potential reversal points when combined with other technical indicators.
Rather than predicting future price movements, trendlines help traders organise price action and understand the broader market structure. Whether analysing stocks, forex, commodities or cryptocurrencies, they remain a popular tool for identifying trends, confirming breakouts and monitoring changes in market sentiment.
Why Trendlines Matter
Trendlines are one of the first tools many traders learn and one of the last they stop using. They are simply straight lines that connect important highs or lows on a price chart, helping traders identify market direction, momentum and potential areas of support or resistance.
Trendlines can be applied across many different markets, including equity indices, forex pairs, commodities, cryptocurrencies, and individual shares. While they are simple to draw, they work best when combined with other forms of technical analysis rather than being treated as standalone trading signals.
How Traders Draw Valid Trendlines
In an uptrend, traders draw a trendline by connecting a series of higher lows. In a downtrend, they connect lower highs. A common rule of thumb is that two points are enough to draw a trendline, but the third touch is what starts to confirm that the market is genuinely respecting it.
The more times price reacts around the same line, the more attention that trendline tends to attract. At the same time, traders avoid forcing a line to fit every candlestick. Instead, they focus on the overall structure of the market, accepting that occasional spikes above or below the line are perfectly normal.
Reading the Technical Chart
The daily S&P 500 (SPX) chart provides a good example of how traders use trendlines alongside other technical tools.
The rising green trendline highlights three areas where buyers stepped back into the market during the broader uptrend. Labelled as the First touch, second touch and third touch, each reaction occurred after price pulled back towards the trendline before moving higher again. These repeated bounces helped reinforce the uptrend and gave traders greater confidence that buyers continued to defend higher prices.
The chart also highlights a key resistance level at 7,575.25. At the time of analysis, the S&P 500 is trading at 7,543.59, placing price just below this resistance while remaining comfortably above the rising 200-day simple moving average, which is currently at 6,973.73. Taken together, these technical levels suggest that the longer-term trend remains positive, even as the market approaches an area where previous rallies have slowed.
US 500 Daily Chart Showing a Rising Trendline, Three Trendline Touches, Key Resistance, the 200-day SMA, Trading Volume and RSI
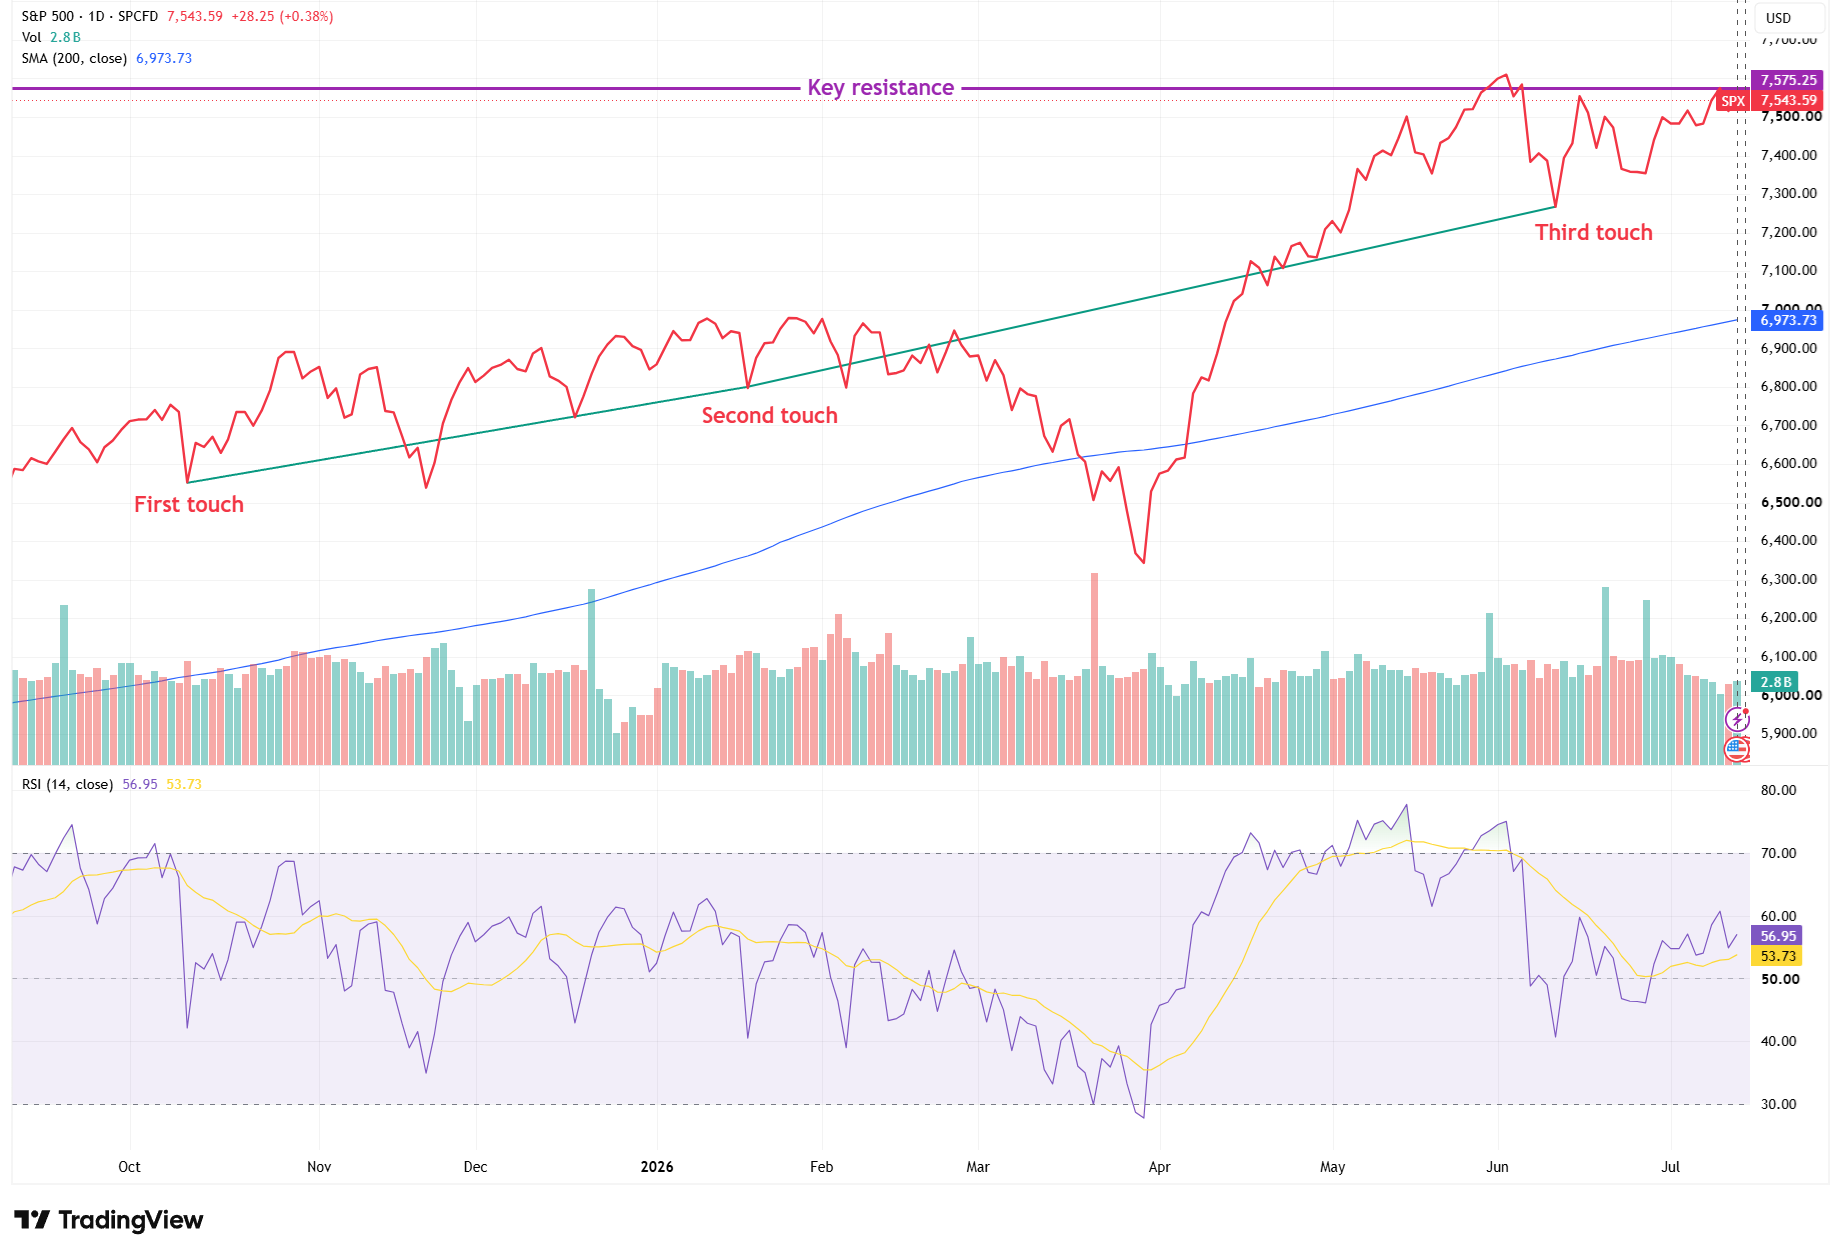
Source: TradingView. Daily chart of the S&P 500 (SPX) showing a rising green trendline with three highlighted touches, a key resistance level at 7,575.25, the 200-day simple moving average at 6,973.73, trading volume, and the 14-period Relative Strength Index (RSI) with its moving average. Past performance is not a reliable indicator of future performance. Data as of 15 July 2026.
When Trendlines Break
One of the biggest mistakes newer traders make is assuming that every break of a trendline signals the start of a new trend.
In reality, markets often move briefly above or below a trendline before reversing back in the original direction. These false breaks can catch traders who react too quickly.
For that reason, many traders wait for confirmation before changing their view. They may look for a daily close beyond the trendline, stronger trading volume, a successful retest of the broken level, or confirmation from nearby support and resistance. Looking at several pieces of evidence together helps reduce the chances of reacting to short-term market noise.
Using the 200-day SMA and RSI
Trendlines become even more useful when they are combined with other indicators.
The 200-day simple moving average is one of the most widely followed long-term trend indicators. When price remains above a rising 200-day SMA, it often suggests that the broader trend is still healthy. In this chart, the S&P 500 is trading well above the 200-day SMA, reinforcing the strength of the longer-term uptrend.
The 14-period Relative Strength Index (RSI) adds another layer of information by measuring momentum. In the lower panel, the RSI is currently at 56.95, while its moving average is 53.73. This suggests that momentum remains positive without reaching the overbought levels that sometimes appear during stronger rallies.
Most traders use RSI as a confirmation tool rather than a trading signal on its own. When price respects a trendline and momentum also remains supportive, traders generally have greater confidence that the underlying trend is still intact.
Why Markets Seem to Respect Invisible Lines
Trendlines are not magical, and they are not mathematically perfect. Markets do not reverse simply because someone has drawn a line on a chart.
Instead, trendlines work because many traders are watching similar price areas. As price approaches a well-established trendline, buyers may become more willing to enter the market during an uptrend, while sellers may become more active around a falling trendline.
Over time, these repeated reactions can become self-reinforcing. The more often a trendline attracts buying or selling interest, the more attention it tends to receive from market participants.
The Bottom Line
Trendlines are one of the simplest tools in technical analysis, but they can provide valuable insight into market direction and changing momentum when used correctly.
Rather than relying on a single line, traders usually combine trendlines with price action, trading volume, moving averages, support and resistance levels, and momentum indicators such as RSI. Looking at all these factors together helps build a clearer picture of what the market is doing and makes it easier to distinguish between genuine trend changes and short-term fluctuations.
No technical tool can predict future price movements with certainty, but trendlines remain a practical way of organising price action and understanding how buyers and sellers are interacting over time.