














Price Gaps: What Do They Reveal About the Market?


Price gaps are among the most recognisable patterns in technical analysis. Whether they follow company earnings, major economic data or unexpected geopolitical events, gaps can provide valuable clues about changing market sentiment and the strength of emerging trends. Understanding why gaps form, and what they may be signalling, can help traders interpret price action with greater confidence.
Why Price Gaps Matter
A price gap happens when an asset opens noticeably above or below the previous session’s closing price, leaving an empty space on the chart where little or no trading has taken place. Gaps are most common in individual stocks and equity indices after the market has been closed, often following corporate earnings announcements, high- impact economic data releases, geopolitical developments, or other major news.
Although gaps are less common in markets that trade almost around the clock, such as major forex pairs, they can still appear after weekends or unexpected news events.
Traders pay close attention to gaps because they often reveal a sudden change in sentiment. They show that buyers or sellers have quickly reassessed an asset’s value before the next trading session has even begun. But not every gap tells the same story, which is why understanding the broader market context is just as important as spotting the gap itself.
Types of Price Gaps in Technical Analysis
Not all gaps mean the same thing. Technical analysts generally group them into four main categories based on where they occur within a trend.
- Common Gaps: These usually appear within an established trading range and tend to have little forecasting value. They are often filled fairly quickly as price returns to its previous range.
- Breakaway Gaps: These occur when price breaks cleanly out of a period of consolidation or pushes through an important support or resistance level. They can signal the beginning of a new trend, particularly when supported by stronger trading volume.
- Continuation Gaps: Sometimes called runaway gaps, these appear during an existing trend. Rather than marking the start of a move, they suggest that the trend still has momentum as more traders join in.
- Exhaustion Gaps: These often develop towards the end of a long trend. They can be a warning sign that buying or selling pressure is beginning to fade before the market changes direction.
The important thing is not to decide immediately what type of gap has appeared when the market opens. Most traders wait to see how price behaves over the next few sessions before deciding whether the move has real conviction or was simply a short-lived reaction.
Analysing Price Gaps on a Technical Chart
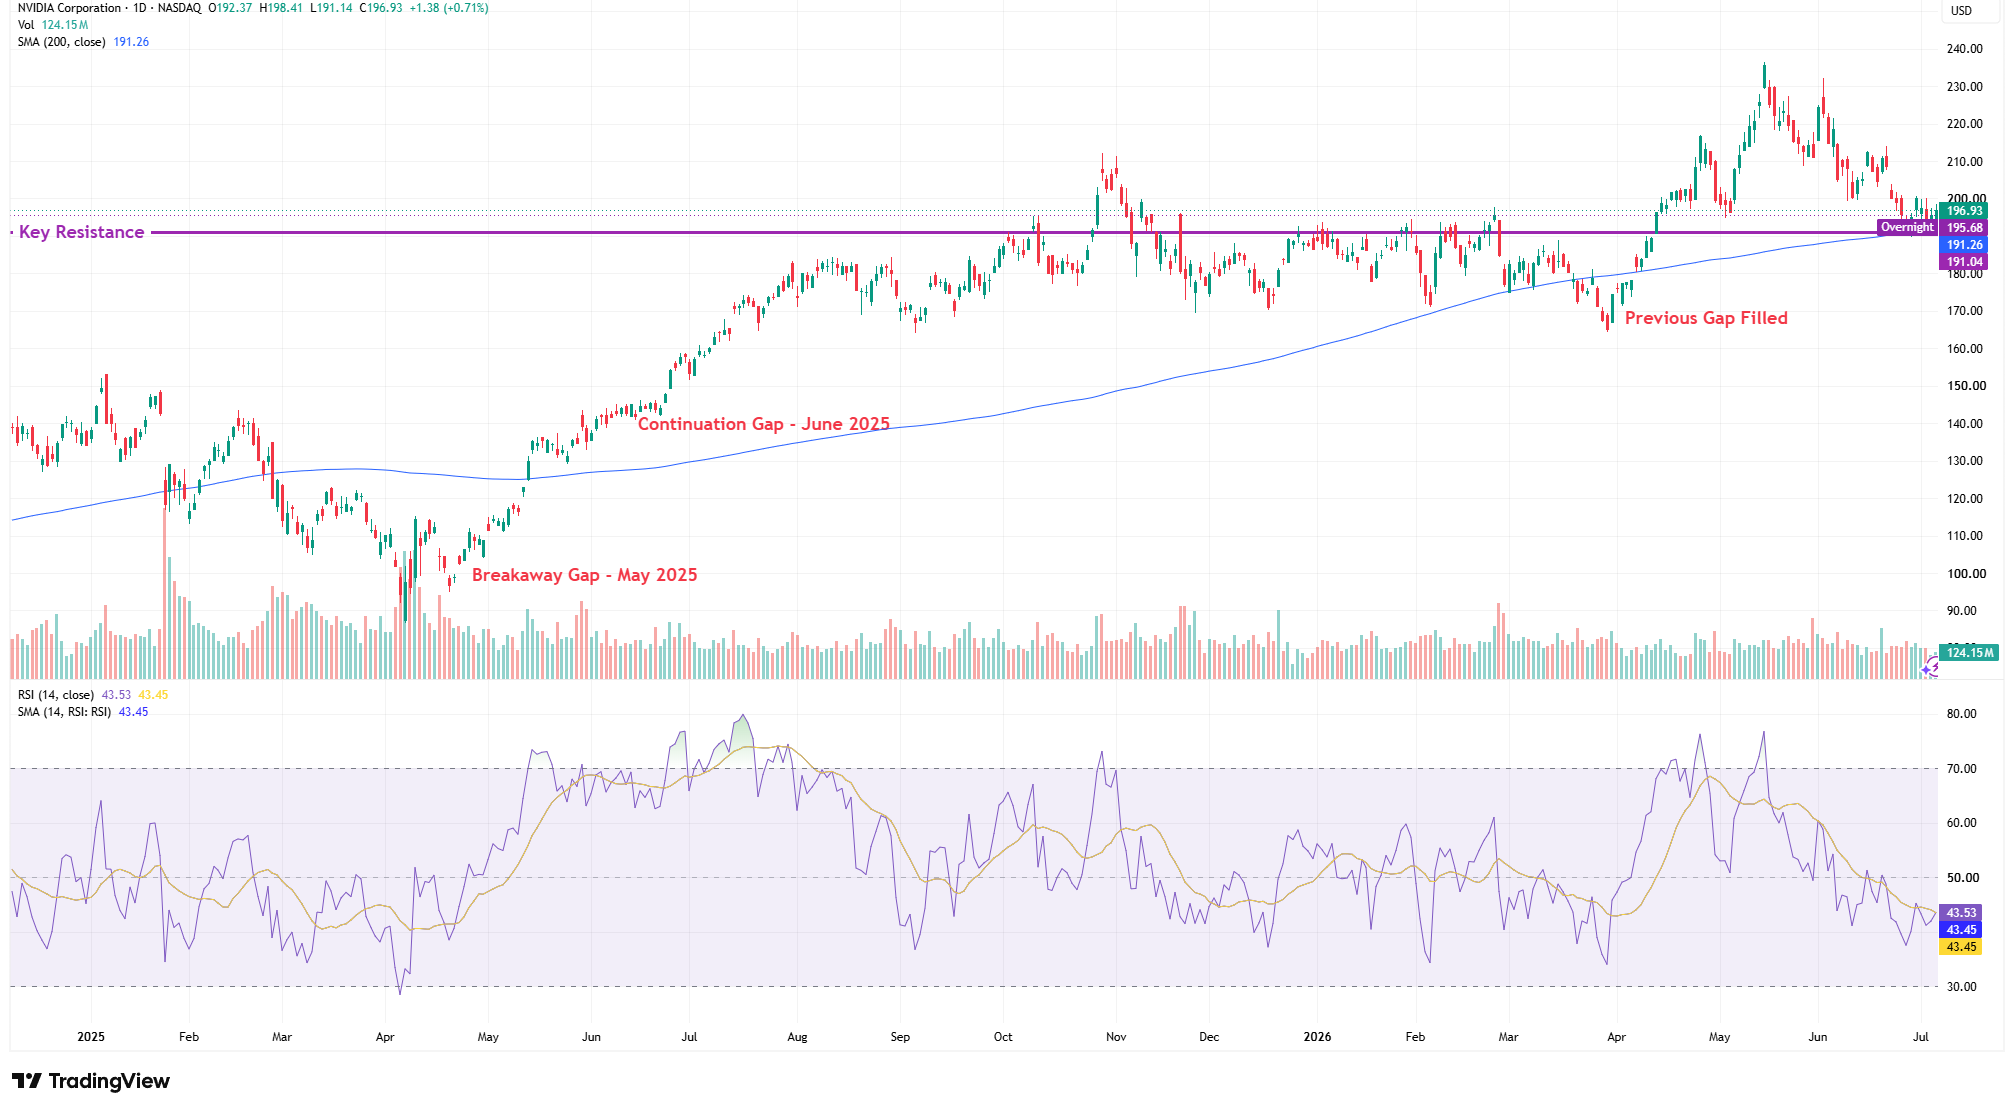
The chart provides several good examples of how gaps develop during a trend. The daily chart of NVIDIA Corporation (NVDA) shows how these gaps interact with longer term trends and key technical levels.
After several weeks of sideways trading during May 2025, NVIDIA formed a clear breakaway gap, opening above its previous trading range before starting a strong move higher. At the same time, trading volume increased, helping confirm that the breakout was supported by genuine buying interest.
As the rally gathered pace, a continuation gap appeared during June 2025. Unlike the earlier breakaway gap, this one developed after the uptrend was already underway. Volume remained healthy, reinforcing the idea that buyers continued to support the move rather than losing interest.
Later in the trend, price pulled back and eventually filled an earlier gap before finding support again. This is a good reminder that while some gaps eventually close, many remain open for long periods, and there is no guarantee that every gap will be filled quickly.
The chart also highlights a key resistance level, while the rising 200 period simple moving average continues to provide long term trend support beneath price. Looking at gaps alongside support and resistance, moving averages, and trading volume helps traders understand whether a move has genuine conviction or is simply a short-lived reaction.
NVIDIA Corporation (NVDA) Daily Chart Displaying Gaps, Volume, and RSI Momentum
Source: TradingView. Past performance is not a reliable indicator of future performance. Data as of 8 July 2026.
Daily chart of NVIDIA Corporation showing examples of a breakaway gap, a continuation gap, a later gap fill, the 200-period simple moving average, trading volume, and the 14-period Relative Strength Index (RSI) with its moving average.
Why Gap Fills Matter
One of the biggest myths in technical analysis is that every price gap eventually gets filled.
In reality, it depends on the type of gap. Common gaps often close fairly quickly because they develop within established trading ranges where price naturally moves back towards its earlier range. Breakaway and continuation gaps, however, can stay open for weeks or even months because they reflect strong buying or selling pressure.
That is why experienced traders rarely enter a trade simply because they expect a gap to close. Instead, they look at the bigger picture by combining gap analysis with trend direction, support and resistance levels, moving averages, candlestick patterns, and trading volume before making a trading decision.
Momentum and Market Psychology
Momentum indicators can also add useful context. In the lower panel, the 14-period RSI is currently around 43.53, while its moving average sits close by at 43.45.
This suggests that momentum has cooled after the earlier rally and that selling pressure has eased. Rather than signaling a strong trend in either direction, the RSI currently reflects a more balanced market.
Most traders use RSI as a supporting tool rather than a signal on its own. If a breakaway or continuation gap is backed by a strengthening RSI, it can add confidence that the trend still has room to continue. On the other hand, if momentum begins to weaken after a strong move, it may suggest that the trend is starting to lose momentum.
From a psychological point of view, gaps reflect how quickly expectations can change while the market is closed. A strong earnings report, unexpected economic data, or a major news event can cause traders to completely rethink what an asset is worth before the opening bell. Understanding why a gap has formed is often just as important as identifying the gap itself.
The Bottom Line
Price gaps are one of the clearest signs that market sentiment has shifted, but they should never be looked at in isolation. Common gaps, breakaway gaps, continuation gaps, and exhaustion gaps each tell a different story, and the surrounding market context is what gives those signals meaning.
Rather than assuming every gap will close or every breakout will continue, traders combine gap analysis with trend direction, support and resistance levels, trading volume, moving averages, candlestick behaviour, and momentum indicators. Putting all these pieces together helps traders understand what the market is really doing instead of relying on just one technical signal.