Dollar Direction in Focus: What FX Charts Are Signalling Now
The Dollar Index Loses Momentum
The US Dollar Index has transitioned from trending to drifting, flattening out into a consolidation. Earlier last year we saw clear momentum (both upward and downward), but now the range has tightened, and familiar trend channels have flattened. The market looks coiled, as if in a “decision zone” with no breakout or breakdown – just tension building…
RSI has been hovering around the midline and MACD histograms have flattened out, suggesting the market is coiling rather than trending. The dollar’s strong trend from months ago has dissipated into choppier, range-bound price action – a shift that often precedes either a significant breakout or a deeper correction, but as of now indicates hesitation.
US Dollar Index – Momentum Fades as Direction Stalls
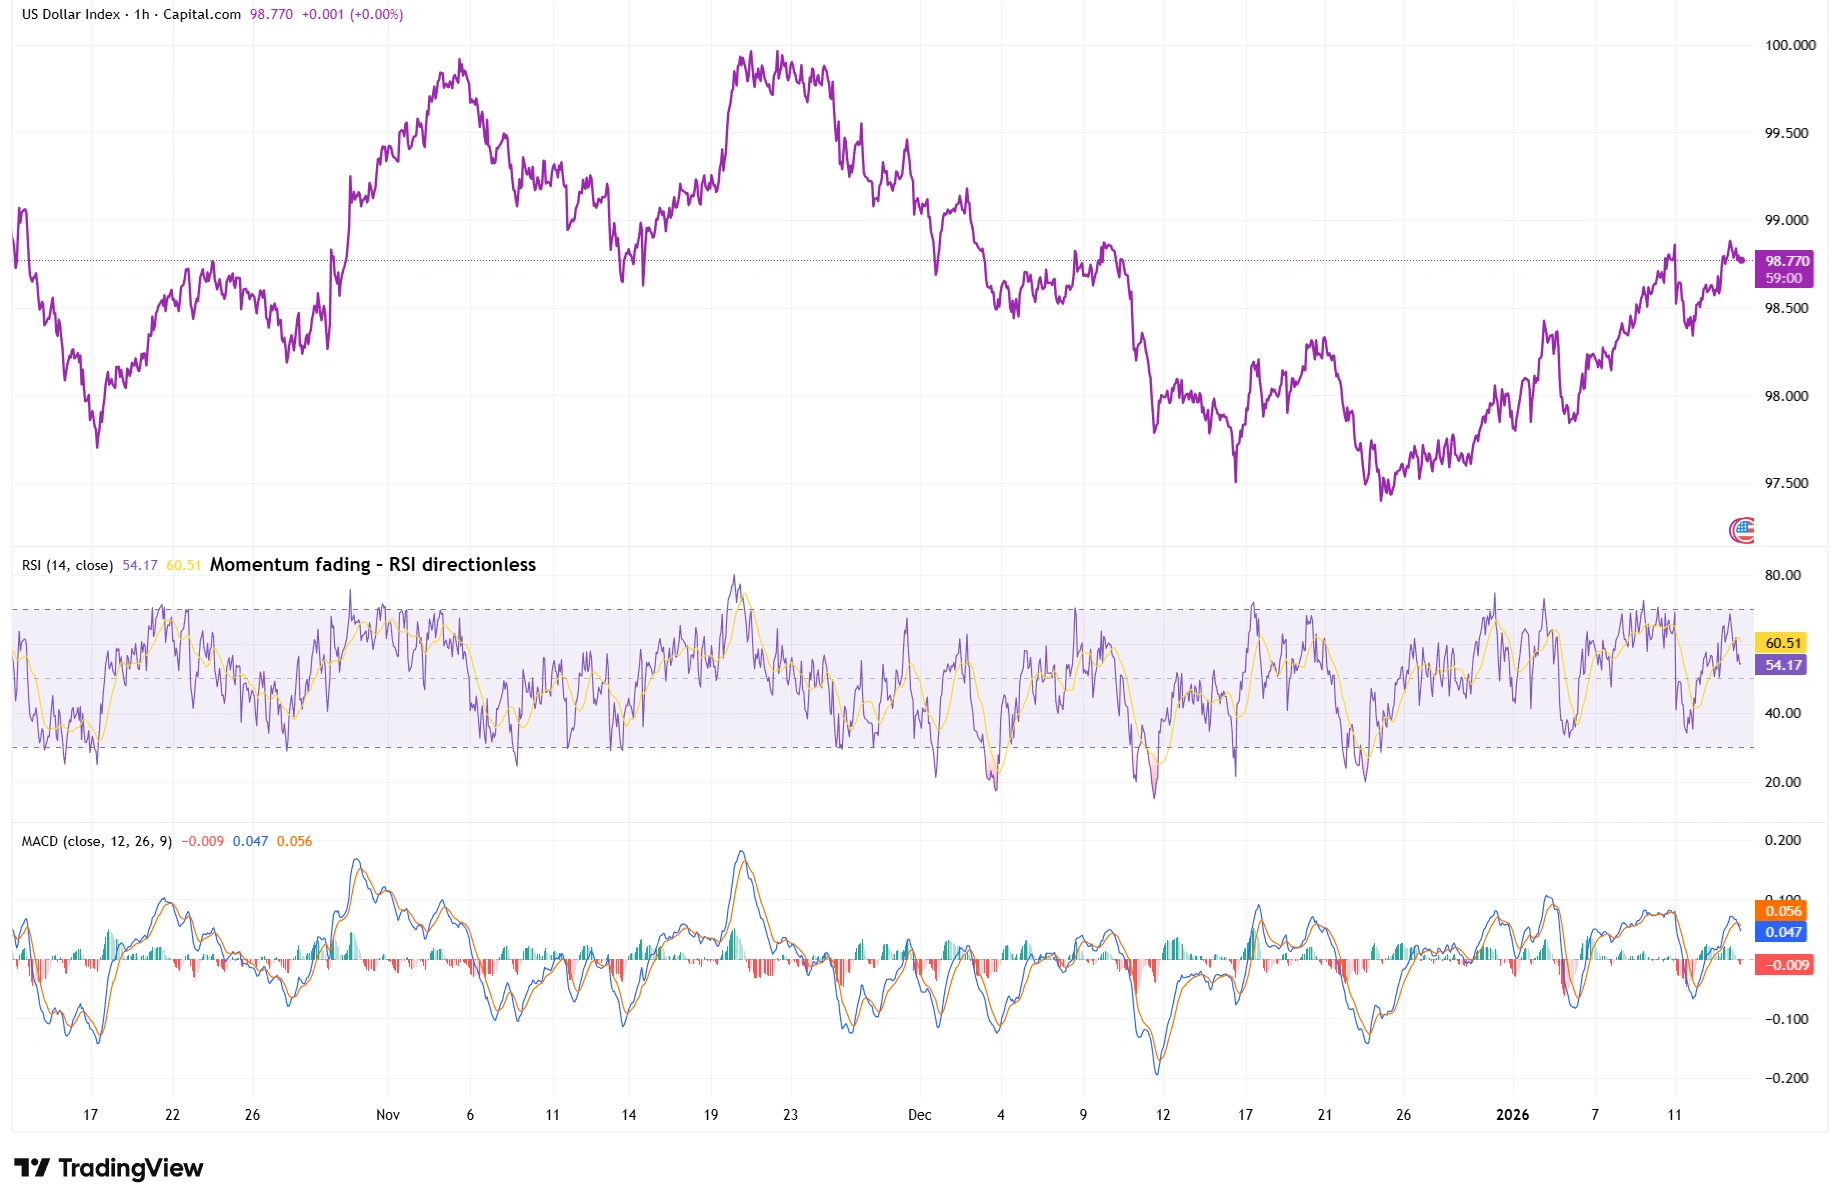
Source: TradingView. All indices are total return in US dollars. Past performance is not a reliable indicator of future performance. Data as of 14 January 2026.
The Dollar Index has flattened into a broader range, with RSI hovering near neutral and MACD momentum fading – signs of consolidation and indecision in the current phase.
Major USD Pairs Lack Follow-Through
You can see a similar lack of conviction across the major USD pairs. EUR/USD has attempted to pop higher more than once, only to be dragged down again. GBP/USD rallies for a bit and then stalls out. Even GBP/JPY, a cross that had decent trending energy recently, is showing signs of short-term fatigue. The pattern is the same: attempted breakouts that fade, with repeated tests of key zones but no clear resolution. The market is probing in both directions, but it isn’t convinced enough to sustain a new trend.
Shifting Rate Expectations on the Charts
The Fed has likely finished its rate hike cycle, and now the conversation has shifted to potential rate cuts on the horizon. That shift is no longer a shock. Much of it has been priced in by the market over recent months. When traders stop reacting to every data point and start waiting for official confirmation of policy changes, charts often settle into exactly the kind of choppy, range-bound patterns we’re seeing. A flashy jobs report or inflation print might move the dollar initially, but the move often fizzles out quickly. The result is a currency market that is digesting a forward-looking view (rate cuts ahead, global growth uncertainty) instead of actively chasing it.
Momentum Indicators Flash Fatigue
On most USD pairs, the RSI is sitting in the middle of its range – neither overbought nor oversold. Likewise, MACD lines are flat or its histogram bars are barely flickering around the zero line. In some cases, we can even spot a bearish divergence, where price pushes a bit higher but an indicator like RSI prints a lower peak. This doesn’t guarantee a sharp reversal, but it suggests the prevailing trend (in the dollar’s case, its prior strength) is running out of steam.
USD/JPY’s chart is a prime example of waning momentum: it recently notched a new peak that the RSI failed to confirm. During that second push, the RSI did not reach the heights it did on the first peak – a textbook momentum divergence. Again, this doesn’t mean an immediate plunge for USD/JPY or the dollar at large, but it indicates the uptrend’s fuel is dwindling.
USD/JPY – Strong Run Faces Pause After Spike
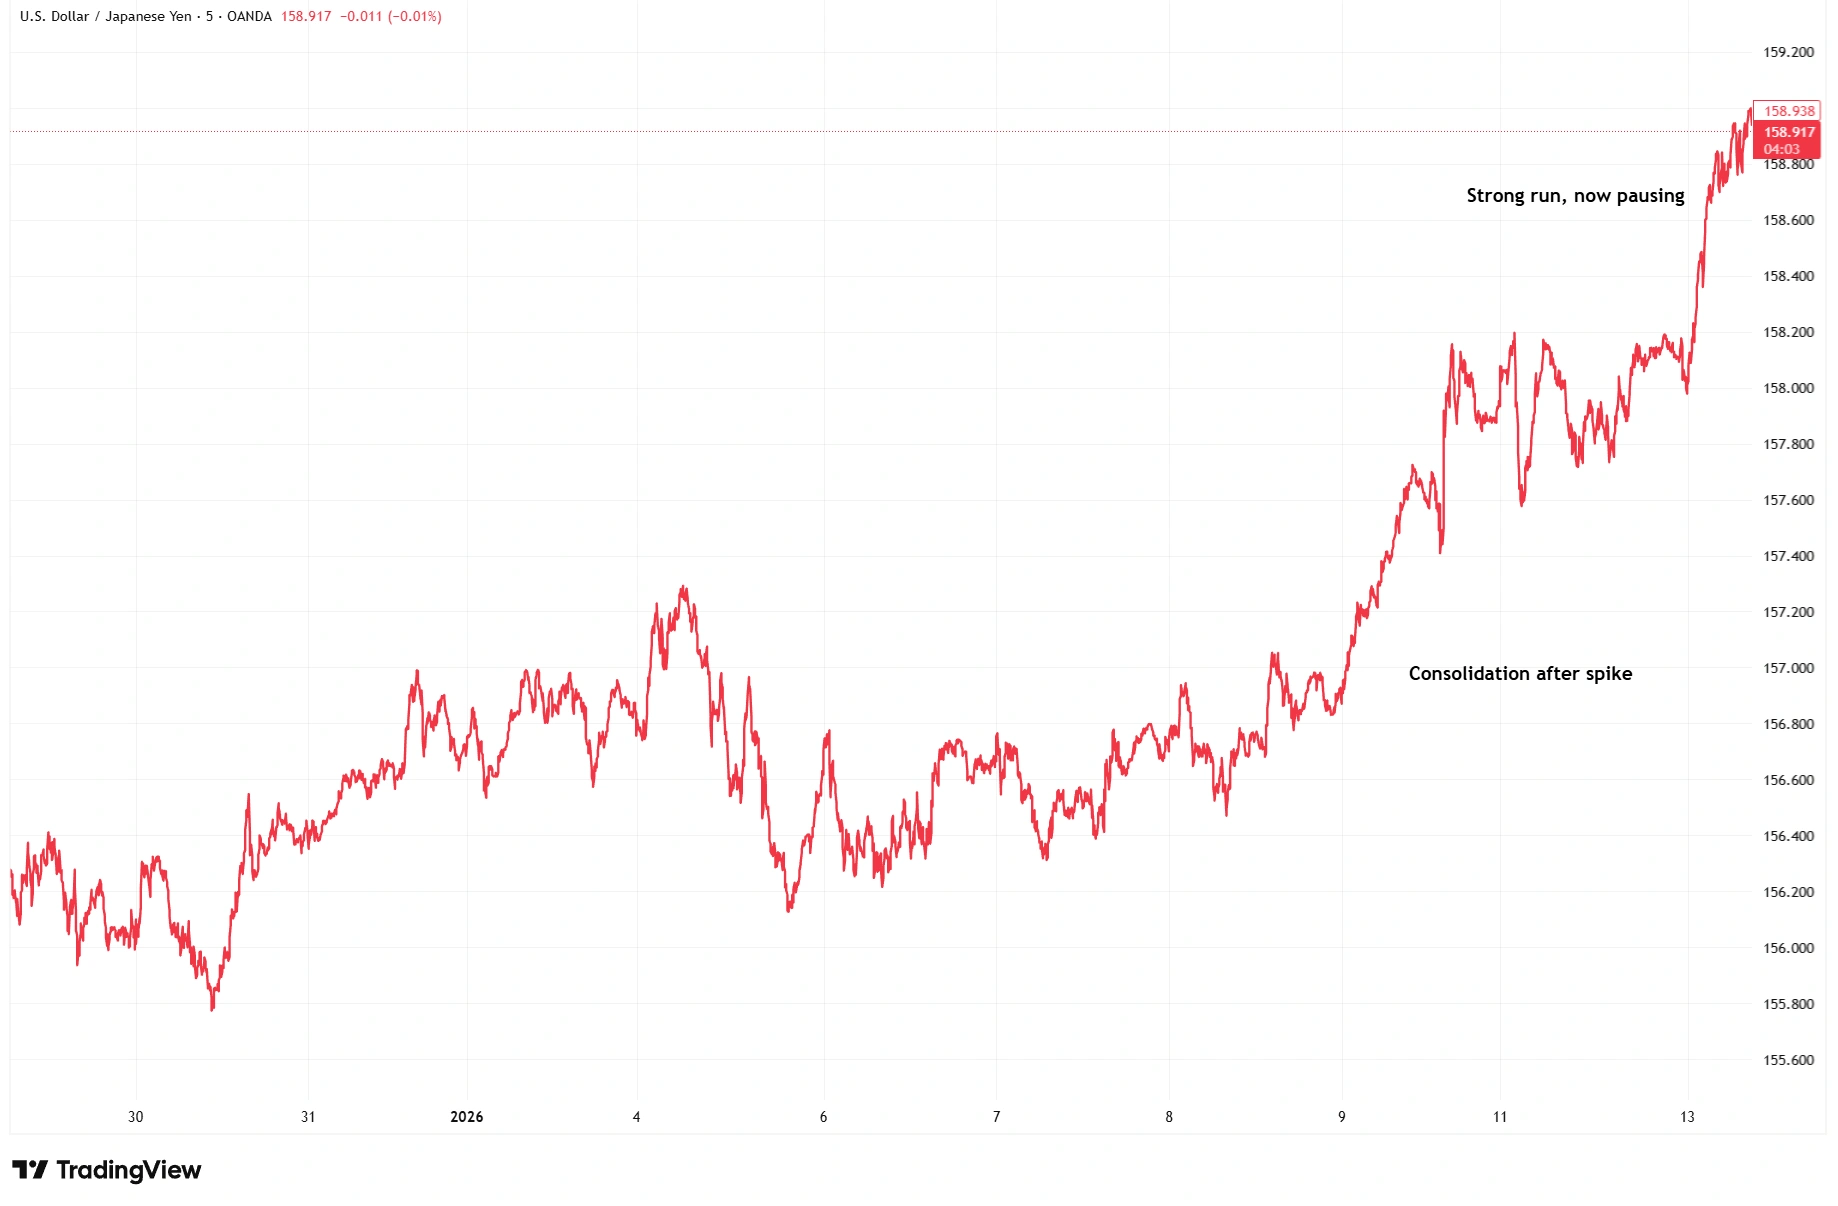
Source: TradingView. All indices are total return in US dollars. Past performance is not a reliable indicator of future performance. Data as of 14 January 2026.
USD/JPY shows strong directional impulse followed by brief consolidation – suggesting energy spent, not reversed.
One Dollar, Many Stories
EUR/USD and GBP/USD have been showing broad dollar softness (the dollar slipping modestly against the euro and pound), whereas USD/JPY stayed comparatively strong. This divergence comes down to what’s happening on the other side of each pair. Rather than assuming a strong dollar or weak dollar across the board, traders need to look pair by pair, respecting what each chart is saying on its own.
Consolidation Sets Up the Next Move
Right now, the dollar isn’t trending in a big way, but that doesn’t mean the FX market is dead. In fact, this kind of quiet consolidation often builds the foundation for the next meaningful move. Traders who remain patient and focus on the chart structure, rather than the daily noise, are usually the ones ready to act when the dollar finally breaks out of its range. The charts may be quiet now, but they are setting the stage.