Silver’s Lag: Why the Little Brother of Gold Might Be Setting Up for a Catch-Up Rally
Gold has dazzled the headlines again. This year it surged to fresh records, helped by hopes of Fed rate cuts and a wave of central-bank buying. Investors chasing safety have poured into gold ETFs and bars, enthralled by its glow. And silver, gold’s quieter, industrial sibling, sits in the shadows. But ask yourself this.. What if the market’s been watching the wrong metal?
Silver’s story rarely makes front-page news. It’s the “little brother” metal, known to lag when gold runs hot. During a market scare earlier this year (April), silver plunged 12% in two days while gold barely slipped. That underperformance pushed the gold-to-silver ratio to a historic 102:1. These episodes reinforce silver’s second-fiddle status. Yet they also set the stage for a plot twist. History shows silver’s quiet coil often stores energy for an outsized move.
The Technical Canvas: A Coiled Spring in Silver
Silver – YTD Daily Chart with Indicators
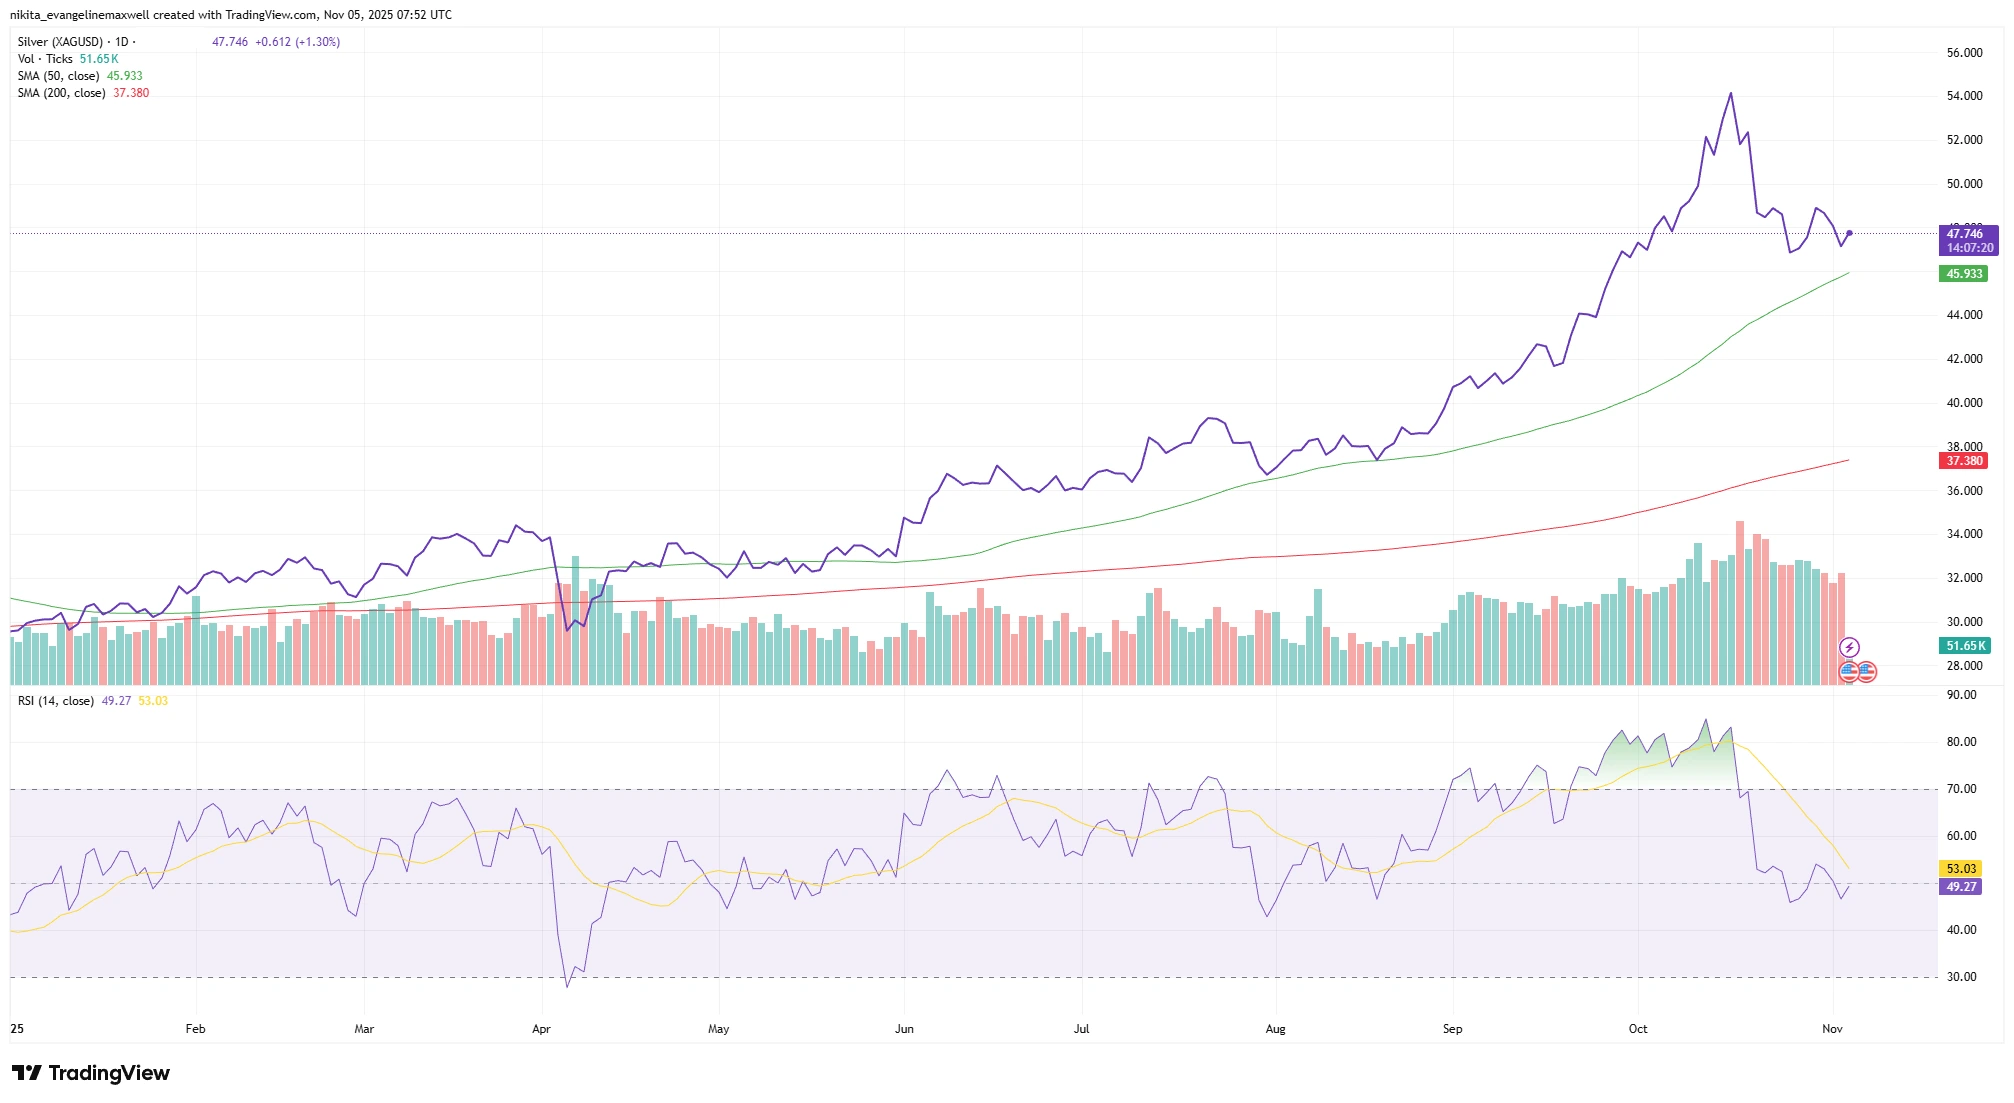
Source: TradingView. All indices are total return in US dollars. Past performance is not a reliable indicator of future performance. Data as of 05 November 2025.
Silver’s daily chart shows a narrowing wedge pattern with RSI quietly rising, a classic sign that momentum may be coiling beneath the surface.
Silver has spent recent months coiling within a narrowing wedge pattern as price swings and volatility shrank. The 14-day RSI quietly climbed even as price drifted sideways, a bullish divergence hinting that downside momentum is fading.
For months, silver’s daily ranges tightened: each dip met a slightly higher floor, each rally a lower ceiling. Volume also lowered (if not, dried up!). This type of quiet consolidation, with soft pullbacks and no real selling pressure, often hints at accumulation. In such situations, momentum builds quietly before snapping into motion.
The RSI has been flashing subtle strength, with higher lows suggesting that sellers are losing control. Momentum is beginning to turn during a sideways move.
Technically, silver is nearing a breakout threshold around its 50-day moving average (a level that’s capped upside for weeks). A convincing push above this, especially on strong volume, would confirm the coil is unwinding. A daily close above the wedge could flip resistance into support.
Traders will watch the RSI for confirmation. A firm cross back above 50 would add confidence. The ideal setup? A volume surge, price breakout, and RSI rally. Until then, silver remains in stasis. But pressure is building.
The Macro Perspective: Dual Identity, New Potential
Silver straddles two worlds: it’s a precious metal like gold, but also an industrial metal. Roughly half of silver’s demand comes from industrial use, far more than gold. This dual role means silver is pushed by two forces – 1. safe-haven flows and 2. industrial optimism.
That makes silver misunderstood. During crises, gold shines. Silver, with its economic baggage, often lags. But now, silver’s hybrid identity might be its strength. Inflation is cooling. Central banks are signalling a shift. At the same time, governments are investing in solar, electrification, and tech, all sectors that rely on silver.
Unlike gold, which thrives on fear, silver could benefit from recovery. Analysts see solar and industrial tech becoming core demand drivers. The market may have overlooked this balance, silver hedges risk and rides growth.
The Gold-to-Silver Ratio: A Signal Worth Watching
Gold vs Silver – YTD Performance Comparison (2025)

Source: TradingView. All indices are total return in US dollars. Past performance is not a reliable indicator of future performance. Data as of 05 November 2025.
Gold has surged ahead this year, while silver lags, but such wide gaps between the two metals rarely persist for long.
The gold-to-silver ratio hovers above 80, a level historically associated with silver underperformance. But such extremes rarely last. In past cycles, when the ratio stretched above 100, silver snapped back hard. It’s not just about value, the ratio also reveals sentiment: gold dominance reflects fear; silver strength reflects returning optimism.
If that pendulum swings, silver could benefit fast. A move back toward 60 on the ratio, whether through silver rising or gold cooling, would mark a shift in tone. Traders are watching closely.
Trading the Quiet Shimmer
To validate a rally, silver must break out of its wedge on strong volume. RSI strength and reclaiming the 50/200-day averages would reinforce it. Watch also for a flattening gold/silver ratio, that could mark silver’s moment.
False breakouts are always a risk. But the setup is clean: limited downside, meaningful upside. Some traders say the best breakouts give you a second chance. Maybe silver already has.
A Shimmer That Could Outshine Gold?
Silver rarely leads. But when it does, it changes the tone of the entire metals complex. Maybe this isn’t about chasing gold’s glow. Maybe it’s about noticing the quiet shimmer that follows.