


Economic Indicators That Move the Markets
Picture this. It’s early morning, coffee in hand, and traders everywhere are hovering over their screens. One number is about to drop. It might be the latest inflation figure. It might be the monthly jobs report. Either way, within seconds it’s across news tickers. And, just like that, markets could jump, stumble, or go haywire.
These “economic indicators” don’t sound thrilling at first glance. But they’re the economy’s vital signs, and when one comes in way above or below expectations, it can jolt stocks, bonds, and currencies all at once. We’ll talk through a few of the big ones, and see how they’ve been shaking things up off late.
Employment Data
If you’ve been anywhere near markets on “jobs day” in the US, you’ll know it can set the tone for weeks. Nonfarm payrolls and the unemployment rate are the headlines traders watch.
Take September 2024. Forecasts were for around 140,000 jobs. Instead? It was 254,000. The Dow hit a record, the dollar jumped, and Treasury yields climbed as traders quietly dialled back hopes for aggressive Fed rate cuts. Growth looked stronger than feared, so even if interest rates stayed high, nobody panicked.
But rewind to July 2024 and the tone flipped. Job growth slowed, unemployment ticked up to 4.1%, and markets suddenly saw a green light for rate cuts. Global equities rallied, yields slipped. Sometimes a softening labour market is like a gentle nudge to central banks: time to step in.
The UK had its own version in August 2025. Payrolls fell for the sixth month straight, but wage growth stuck above 5%. That’s awkward, slowing hiring but stubborn pay inflation. The BoE wasn’t in a rush to cut rates, the pound edged higher, and gilt yields stayed firm. A reminder that jobs data isn’t just about headcount; the pay packet matters too.
Inflation
Inflation is one of those things that quietly sits in the background… until it doesn’t. Central banks hate when it runs hot, because it eats away at purchasing power and forces them to raise rates.
In January 2025, when US CPI for December showed prices rising more slowly than expected. Traders felt a sigh of relief. Stocks jumped, bond yields fell, and everyone started betting on more Fed cuts. Contrast that with a hotter-than-expected reading just months earlier, which had done the opposite and rattled Wall Street.
In June 2025, the UK got an unpleasant surprise, inflation hit 3.6%, the highest in a year. Higher fuel, transport, and food prices put the brakes on gilt rallies and lifted the pound.
Across the euro zone, the story was different. By August 2024, inflation had cooled to 2.2%, its lowest in three years, thanks mostly to cheaper energy. Markets started pricing in more ECB cuts, although policymakers kept one eye on sticky service prices.
GDP
GDP is the grand total of everything a country produces. Strong growth usually means happy markets. Weak growth? Not so much. But it’s rarely that simple.
Q1 2024 in the US looked rough. GDP was up just 1.6% while inflation ticked higher. Investors hate that combo, slower growth with rising prices. And they sold stocks, pushed yields up, and strengthened the dollar, figuring the Fed would hold rates steady for longer. Fast-forward to Q2, and it was like a different economy. Growth hit 2.8%, inflation cooled, and markets got their “Goldilocks” moment. Bond yields eased, stocks stayed strong, and traders started pencilling in multiple rate cuts.
Meanwhile, in Q4 2024 the UK narrowly dodged recession. Growth squeaked in at 0.1% instead of slipping negative. The pound firmed a touch, gilts stayed flat, but the bigger story was relief, especially as Germany and France shrank. Still, underlying weakness meant optimism stayed muted.
Global Market Reactions to Key Economic Data (2024-2025)
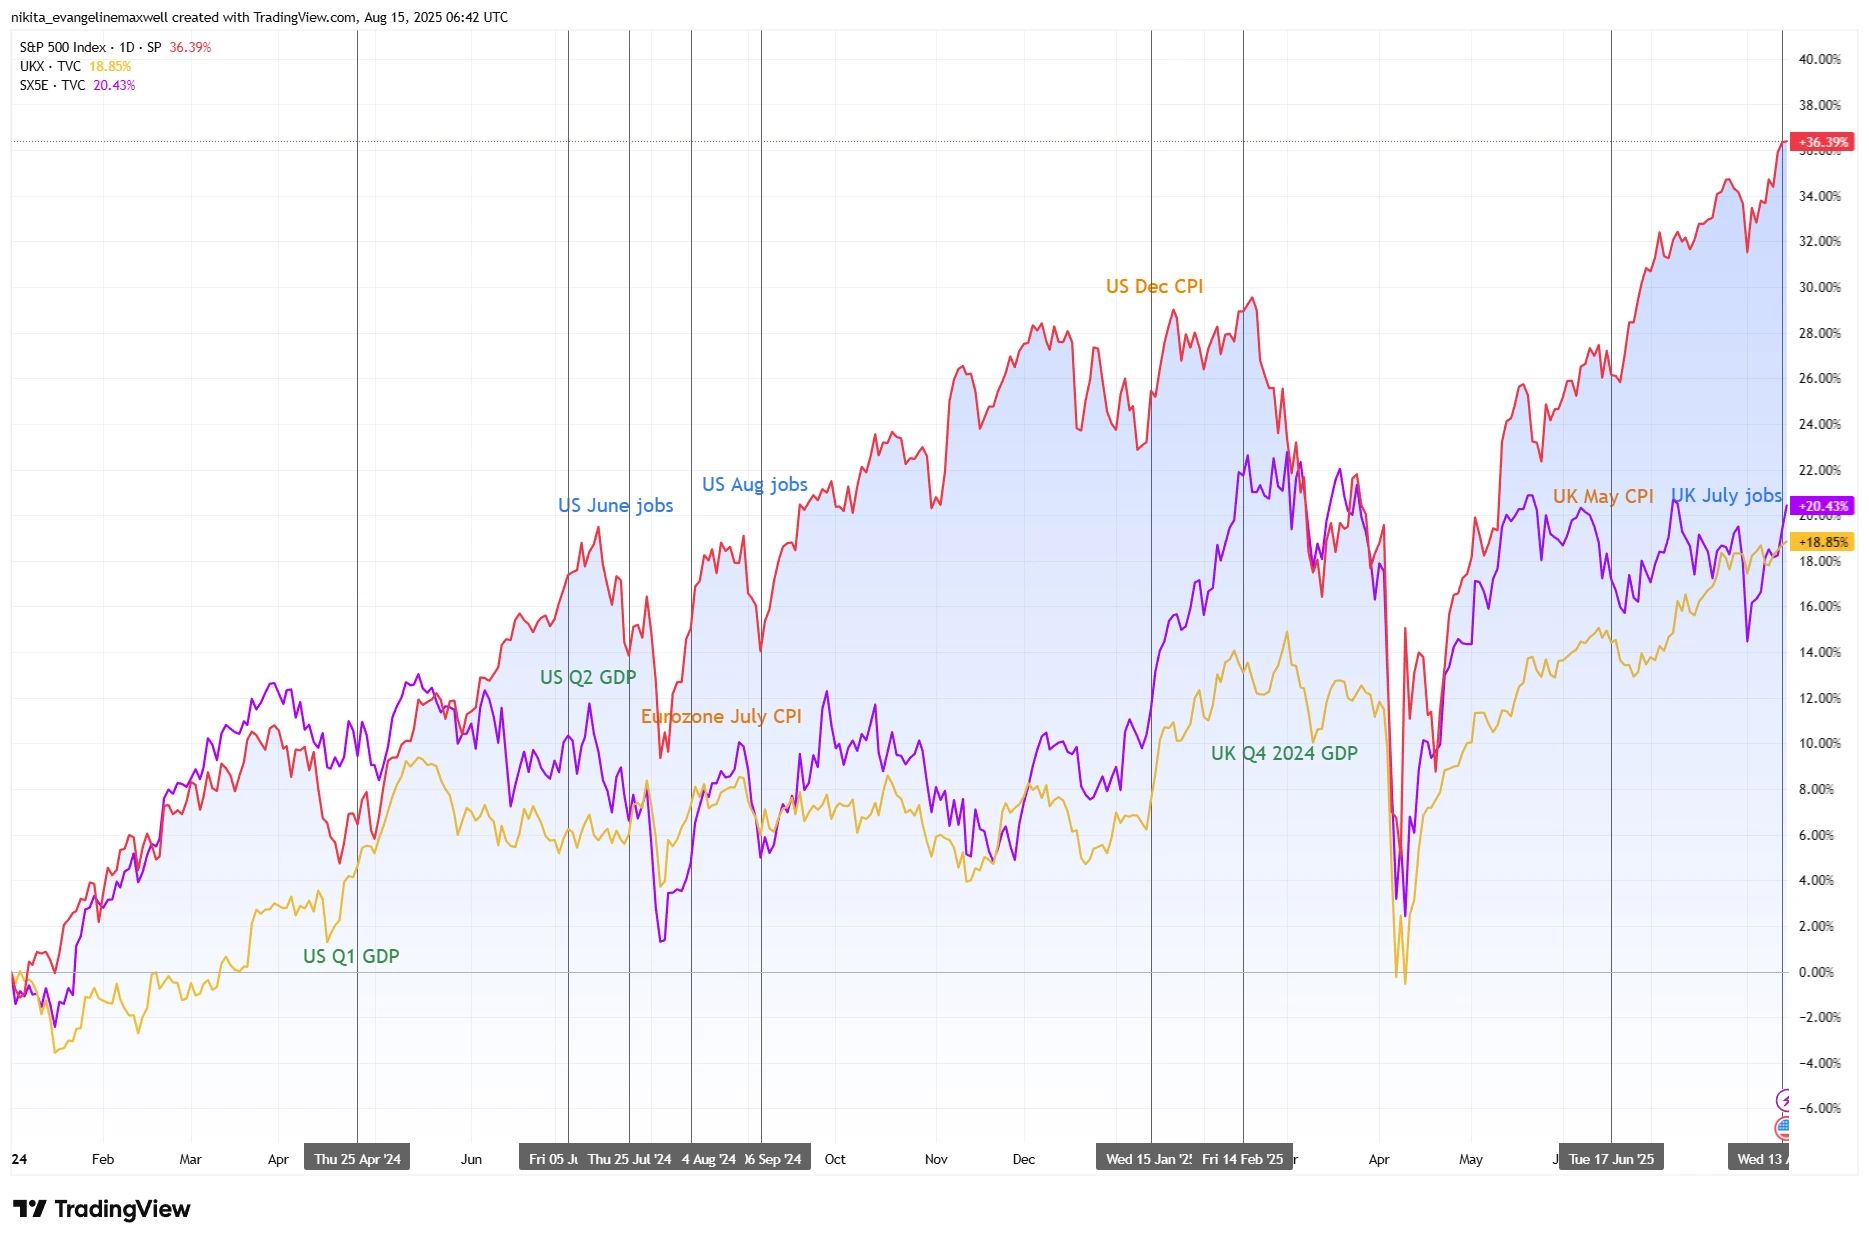
Source: TradingView. All indices are total return in US dollars. Past performance is not a reliable indicator of future performance. Data as of 15 August 2025.
Bottom Line
These numbers might look like dry stats in a spreadsheet, but they’re live wires for markets. The past couple of years have shown just how quickly sentiment can pivot, one morning you’re staring at a growth scare, the next you’re riding a relief rally. The trick isn’t to predict every figure. It’s to know when they’re coming, what’s expected, and how far reality strays from the forecast. That’s where the real market moves often begin.