On Friday, 20 February, the EC Markets team joined Limassol Reds and William’s Dog Shelter for a CSR initiative focused on community engagement and animal welfare. Alongside a financial contribution to support the shelter’s ongoing work, the day brought both teams together through hands-on involvement, including walking dogs and spending time with volunteers and staff.
Financial markets move for a reason, and very often that reason is already scheduled on the economic calendar. Interest rate decisions, inflation updates, employment data and growth releases are among the strongest catalysts of volatility across forex, indices, commodities and crypto. The economic calendar brings these events together in one place, giving traders the advantage of preparation rather than surprise. Understanding how to interpret this tool is an essential part of trading with intention and clarity.
Some market moments feel louder than others; not because of headlines alone, but because several signals arrive at once and prompt investors to rethink the bigger picture. The last week of January and the first week of February was one of those moments.
EC Markets will participate in Money Expo Mexico 2026 as a Diamond Sponsor on 18-19 February 2026 at Centro Banamex, Hall A, Mexico City.
From Booth 22, our team will showcase how EC Markets delivers global market access through regulated operations, advanced trading platforms, and tailored solutions for brokers, institutional partners, and active traders.
Europe has long traded at a valuation discount to the US, visible across simple headline metrics such as P/E and P/B. What is more striking is that, even in 2026 and even after periods of strong performance in European indices, the discount remains wide enough to keep resurfacing in allocation discussions. So, the question is not whether Europe is “cheap” in relative terms, but whether the discount is beginning to look excessive in relation to the region’s earnings outlook and balance-sheet resilience, or whether it still reflects deeper, structural differences that are unlikely to disappear.
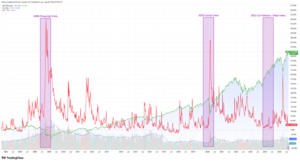
In finance, the yield curve shows how much it costs the US government to borrow for different lengths of time. Most people hear about it only when it inverts, when short‑term rates rise above long‑term ones, because that pattern has historically appeared before recessions. But the yield curve is doing much more than flashing warnings. It is telling a story about how markets see growth, inflation, and future Fed policy.
Picture the scene: early afternoon on the first Friday of the month. Suddenly, charts across the board start whipsawing – currency pairs go up and down, indices go up and down, and even gold can’t make up its mind. Welcome to Non-Farm Payrolls (NFP) Friday. Once a month, this US jobs report hits the wires and global markets often pause and brace for impact.
As 2025 drew to a close, markets continued to digest the after-effects of aggressive policy shifts in prior years. Q4 2025 didn’t bring new shocks but instead reinforced themes that had been building throughout the year. The quarter provided a moment of relative stability across asset classes, with monetary policy becoming clearer but fiscal constraints coming into sharper focus. This piece explores how Q4 played out across markets, what 2025 taught investors more broadly, and what 2026 may have in store – through a lens of cautious realism rather than bold forecasting.
On Thursday evening, December 11th, we officially opened our new EC Markets office in central Limassol, marking an important milestone in our ongoing growth.
Markets ended the final week of November on firmer footing as investors priced in a growing likelihood of a Federal Reserve rate cut at the December 9-10 meeting. Softer US data following the post-shutdown backlog and easing Treasury yields helped shift sentiment toward a more dovish outlook.
EC Markets (ecmarkets.com) marked a milestone appearance at the Finance Magnates London Summit 2025 (fmls:25) from 25-27 November at Old Billingsgate, London. As a Diamond Sponsor, our team welcomed partners, clients, and industry peers to Booth 32 for discussions on market access, technology, and the regulatory landscape for the year ahead.
Last week’s backdrop was shaped by the end of the 43-day US government shutdown and cautious tone from central banks. The funding extension cleared a key uncertainty but created a backlog of economic data, with the October CPI report cancelled.
Inflation is a driver of markets. When new inflation numbers come out each month, traders of currencies, stocks, bonds and commodities all pay attention. A sudden rise or fall in inflation can quickly change expectations for interest rates and move markets.
EC Markets will participate in the Finance Magnates London Summit 2025 (FMLS:25) as a Diamond Sponsor on 25–27 November 2025 at Old Billingsgate, London.
EC Markets is pleased to announce officially its membership of UNICEF UK*’s Business Network in support of the world’s most vulnerable children. This forms part of EC Markets’ broader strategy to strengthen its international footprint and consolidate its market influence while simultaneously contributing to meaningful endeavours, especially those aimed at improving and enhancing the lives of vulnerable and at-risk children worldwide. Through their membership, EC Markets seeks to mobilise its resources and expertise to support programmes that provide educational opportunities, healthcare, and essential services to children in need.
The final week of October delivered a mix of central bank decisions, earnings results, and macroeconomic data. In the US, the Fed cut interest rates by 25 basis points at its 29-30 October meeting, lowering the target range to 3.75%-4.00%.
Are you ready to step into the markets with the knowledge and the confidence needed to succeed? Introducing EC Academy. The trading education hub for a smarter, simpler, and entirely free way to learn trading online.
Success in trading rarely happens by accident. It usually grows out of doing the right things, over and over again. That’s where having a routine makes all the difference.
We’re proud to share that EC Markets has been awarded “Best Trading Conditions” at the UF Awards Asia 2025, held during iFX Expo Asia, one of the region’s most influential financial events.
“I’m interested in FX, but I’m scared to use real money right away...”
This is where demo trading apps come in handy — they let beginners learn trading with zero risk.
A demo trade is a practice tool that allows you to experience real market movements using virtual funds. It’s perfect for beginners and an essential step for anyone touching FX for the first time.
It’s no secret why most traders lose money: the stats are bleak. But these losses usually aren’t random. Common traps like ignoring risk limits, over-leveraging and trading on emotion trip up beginners (and even seasoned players).
We’re proud to announce our sponsorship of the Speaker Hall at iFX Expo Asia 2025, one of the most influential financial events in the region, hosted this year in Hong Kong.
According to the Finance Magnates Q3 2025 Intelligence Report, EC Markets achieved a total trading volume of $3.081 trillion, marking our strongest performance yet as a global multi-asset broker.
Leverage in trading can feel like a secret superpower, letting you do more with less. But what exactly is leverage? It simply means borrowing funds from your broker to better your trading position beyond what your own cash could fund. Leverage is powerful because it magnifies both gains and losses, so it’s vital for traders to use it wisely.
We are delighted to welcome Omar Qumuq as our new Managing Director for the Middle East, based in our Dubai office. Omar joins us at a pivotal moment as we focus on expanding our presence in the region. He brings with him a wealth of experience in the financial services and trading sectors, shaped by both regional knowledge and a global perspective. Before joining us, he held senior roles at Doo Group, STARTRADER, and MultiBank in the UAE.
After two long years of rate hikes, the pendulum has finally swung the other way. Both the Fed and ECB have started cutting interest rates, easing financial conditions that had been tightening since 2022. But here’s the twist, markets on both the sides aren’t reacting the same way.
In Q3 markets pivoted sharply on policy divergence. The Fed signalled an imminent easing cycle, while many governments moved toward fiscal restraint. Growth and employment weakened enough in the US to prompt a late-September rate cut, even as fiscal policy pulled back.
Markets began Q4 steady despite the US government shutdown on 1 October, which halted key data releases including the September jobs report. Investors largely viewed it as temporary and focused on the Fed’s next steps.
If you’ve ever travelled abroad, you’ve seen exchange rates at work. One year your pound buys you two cappuccinos in Rome, the next year barely one and a half. For traders, those shifts aren’t just holiday quirks – they’re opportunities. The big question is simple: what moves currency pairs?
When Liverpool FC signed Swedish striker Alexander Isak, the football world took notice, it was a strategic move that showed how champion teams are built with precision and long term planning. In many ways, the process of creating a successful football squad is very similar to how traders build a winning portfolio in the financial markets.
A decade ago, most traders barely used the term ESG. Fast-forward to today, and you can’t not know it. Every fund manager, every headline, every panel discussion seems to have those three letters tucked in somewhere. ESG – short for Environmental, Social and Governance.
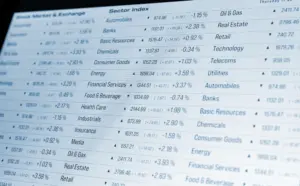
Stock markets often move in waves – one sector cools as another heats up. It’s how markets rotate. Recently, the tech-heavy “Magnificent Seven” names have lost steam while cyclicals like energy and industrials have been rallying. This is why traders are eyeing relative strength charts. These charts show which sectors are outperforming and hint at who might lead next. For example, a recent analysis noted consumer discretionary and communications stocks are firmly in the “leading” quadrant on a relative rotation graph, whereas tech is rolling into “weakening” territory. Healthcare is meanwhile just beginning to climb from lagging to improving, suggesting its turn could be near.
Central banks finally look ready to ease up. After two years of aggressive hikes, rates are edging lower. The BoE has trimmed Bank Rate to 4% from 5.25%, the ECB has cut back to 2% from its peak of 4%, and the Fed followed with a reduction last week.
Markets finally got what they had been waiting months for – the Fed’s first rate cut since late 2024. The move arrived in a week where the data told two stories at once: inflation showed fresh signs of stickiness, but broader momentum looked soft enough to justify easing.
Traders on the floor of the NYSE notice on Wednesday as Federal Reserve Chair Jerome Powell announced a 0.25% cut in the Fed’s key interest rate. It was the Fed’s first rate cut since last December, lowering the federal funds rate to 4.00-4.25%.
September’s second week was all about balancing softer data with central bank caution and a few geopolitical flare-ups. In the US, the August CPI print came in at +0.4% MoM, pushing the annual rate to 2.9%, its highest level since January. Core CPI held steady at 3.1%, which was enough to reassure investors that underlying pressures aren’t spiralling.
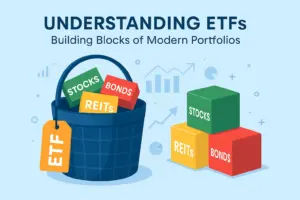
Ever stared at the stock market and thought, where on earth do I start? Picking individual stocks can feel like choosing a single chocolate from a box without knowing the flavours – exciting, but also slightly nerve-racking.
Big global banks like JPMorgan, Deutsche Bank, and HSBC aren’t just cornerstones of the financial system – they’re also playgrounds for technical traders.
The Japanese yen is at a crossroads. After years of playing dual roles – safe-haven asset and funding currency for carry trades – it faces a turning point. BoJ is hinting at ending its era of ultra-low rates, so will the yen regain its safe-haven shine or remain the world’s favourite funding currency?
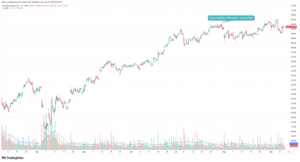
Eurozone inflation has nudged above the ECB’s 2% target, coming in at 2.1%. At first glance, that’s hardly anything, but traders pay attention to small shifts. The reason is because even a modest overshoot can shape expectations around interest rates, and that quickly effects equities. Markets reacted in kind: the STOXX 600 slipped about 1.5%, while the DAX dropped over 2% as investors re-adjusted their holdings. Even a small move in hard data can create a ripple effect on markets.
Every football fan knows the excitement before a big match, where the countdown begins and every detail matters. For the football pros, it’s about training, strategy and focus. The Liverpool FC team doesn’t just show up on game day, instead, they prepare, they analyze, and they rehearse every move to maximize their chances of victory.
Ever looked at a market chart and thought, what on earth just happened? Prices rise one day, drop the next, and investors are left confused. That’s volatility.
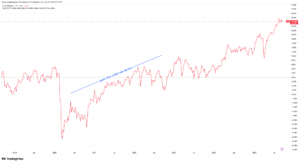
Traders often mark neat horizontal lines on charts for support and resistance, but sometimes those levels seem to hold firm and other times they break with no warning. Why the difference? The answer usually lies in volume. A support line backed by high trading volume is a lot more likely to hold than one drawn in thin air. As Investopedia notes, “the more buying and selling that has occurred at a particular price level, the stronger the support or resistance level is likely to be”. In short, volume analysis is the missing piece that confirms whether your support or resistance line is meaningful.