One Asset, One Chart, One Lesson: Gold
There are times when a chart looks so extended that every instinct says, “This has to pull back soon.” Gold gave that exact feeling through much of October. It moved fast and it barely paused. Every dip was small and short-lived. And if you were looking at any typical momentum indicator (like the RSI), you’d have seen the same message repeating: overbought.
Gold (XAU/USD) with RSI (Sept to Dec 2025)
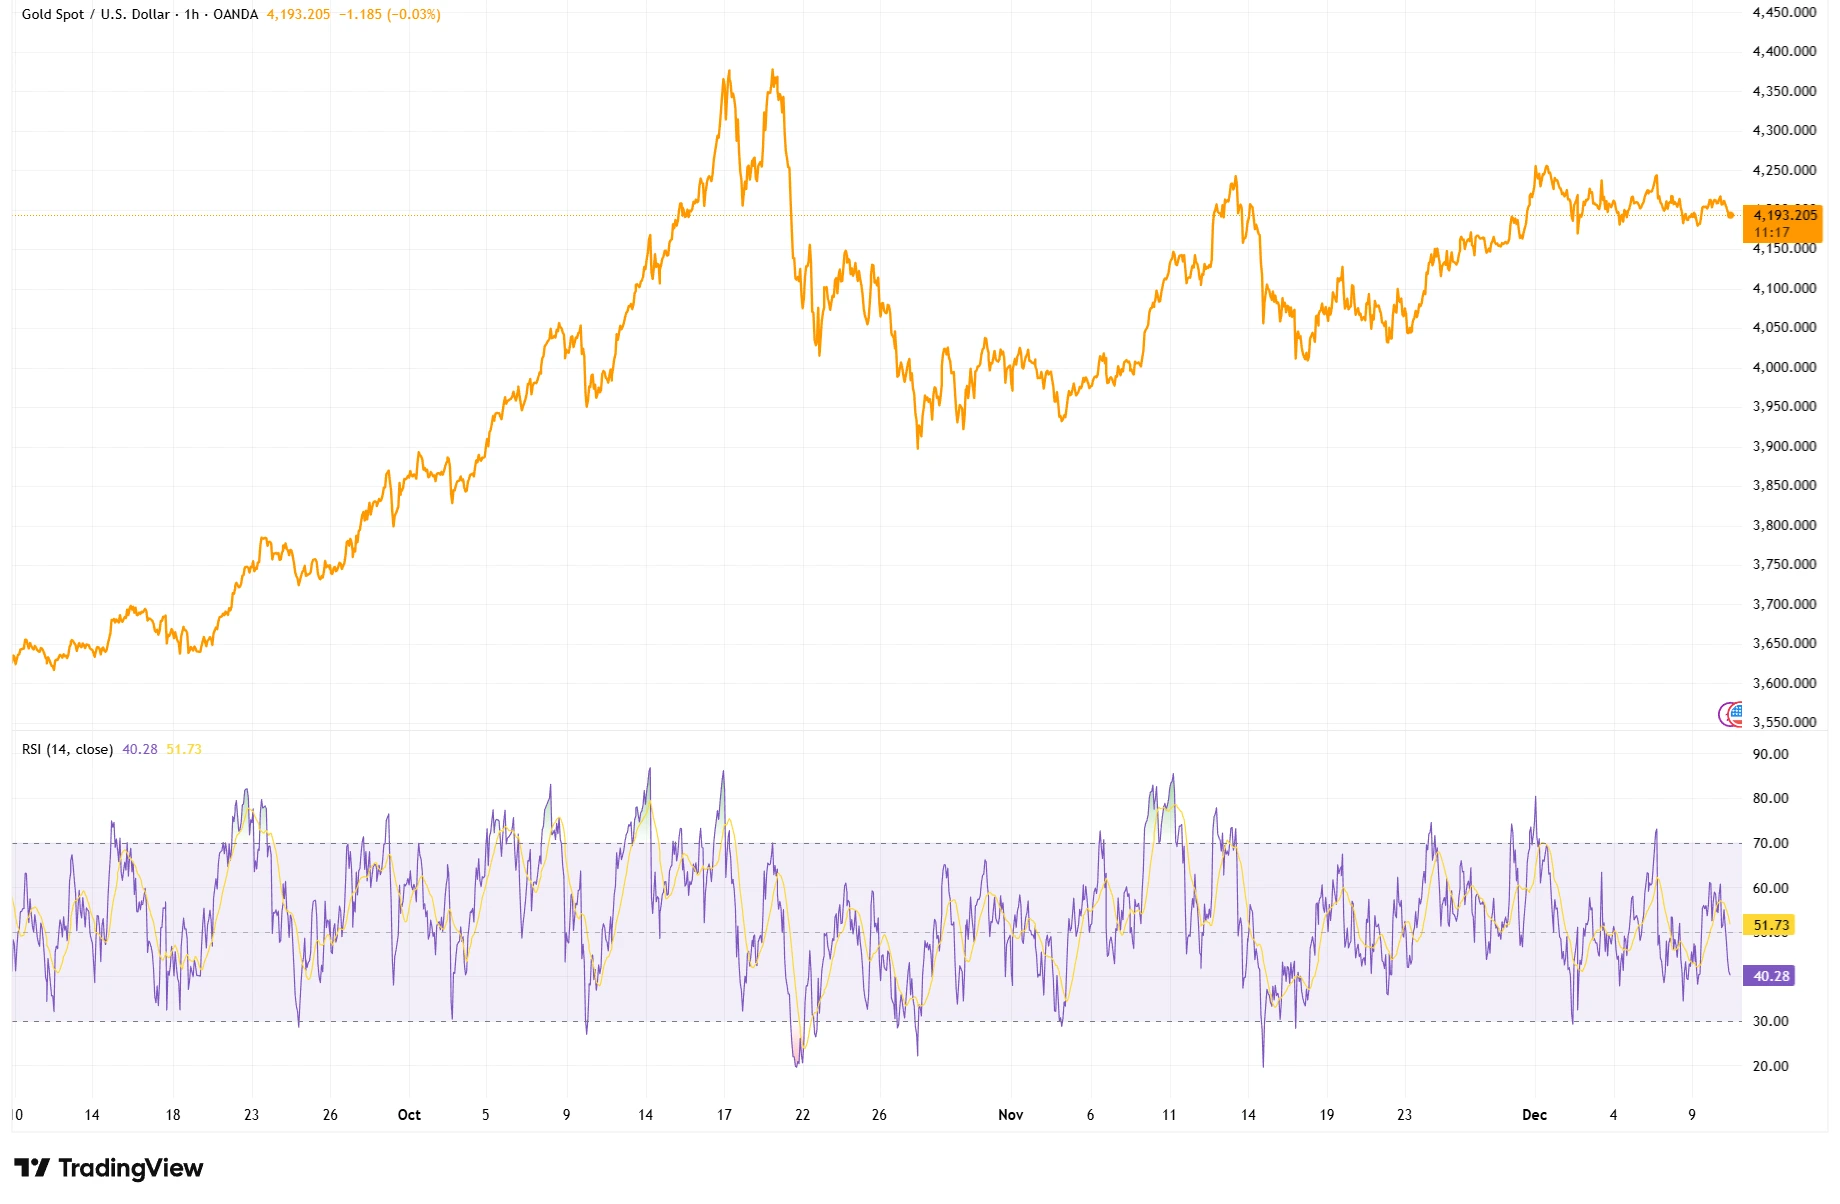
Source: TradingView. All indices are total return in US dollars. Past performance is not a reliable indicator of future performance. Data as of 10 December 2025.
A strong October rally kept RSI elevated. Despite looking “overbought,” gold pushed higher. Pullbacks in November stayed supported, and structure held through December.
For many traders, that’s the red flag. “Time to fade this,” they think. “It can’t keep going forever.” But here’s the catch: sometimes it does. That’s the lesson this chart teaches.
Let’s start with the structure. From late September through to the back half of October, gold climbed nearly in a straight line. The 1-hour chart you’re looking at shows a clear, aggressive uptrend. It wasn’t just a few candles pushing higher, it was session after session of controlled momentum, with shallow pullbacks and steady higher highs. You could call it a melt-up, but it wasn’t disorderly. It was strong.
This is where the trouble begins for many traders. When price moves like that and indicators start flashing “overbought,” the instinct is to bet against it. But what’s happening beneath the surface? The price is being supported, pullbacks are getting bought quickly, and each bounce is coming in at a higher level. That’s not exhaustion. That’s participation. Buyers are in control.
Now, to be fair, the move did eventually snap back. The high in late October gave way to a sharp drop. Price pulled back, hard, and that’s where a lot of people might’ve felt validated if they had tried to short earlier. But here’s where it gets interesting: the drop didn’t break the structure. It was deep, yes. But what followed wasn’t collapse, it was a recovery.
Through November, gold steadied itself. It chopped around, rebuilt support, and began grinding higher again through the second half of the month. By December, the tone had shifted once more. The extreme momentum of October wasn’t there, but the strength still was. And all of this happened while price stayed well above the September base. That’s what matters.
The mistake a lot of people make (especially on intraday charts) is treating RSI and other momentum indicators as warning lights rather than context clues. RSI doesn’t predict a reversal. It reflects how strong the current move is. When something like gold is trending hard, RSI being “overbought” isn’t a sell signal. It’s just telling you the buyers are serious.
And when that trend is supported by broader themes, things like rate expectations, inflation concerns, or safe-haven demand, those strong moves can last longer than you expect. That’s exactly what we saw on this chart. The market had a reason to rally, and it kept doing so, even as short-term tools told traders it was already stretched.
So what should you take from this? Next time you see a move like that, don’t fixate on one number or one reading. Step back. Look at how price is behaving. Is it holding key levels?? Are dips getting bought?? Is the overall direction still intact? If the answer is yes, that might not be a reversal setting up. It might just be a trend doing its job!
Gold didn’t top because RSI was high. It pulled back when momentum truly ran out, and even then, the buyers came back. That’s the real lesson here: strong doesn’t mean over. Overbought doesn’t mean done. A trend isn’t finished until structure breaks and participation fades.
One asset. One chart. One lesson.