Liquidity Traps in Oil: How Smart Money Trades Geopolitical Spikes
Headlines move oil. Structure decides who wins.
When geopolitics heats up, oil is usually the first market to react. A sudden escalation, a threat to supply routes, or even a hint of regional instability can push crude higher within minutes. March 2026 was a recent example. As tensions in the Gulf raised fresh concerns around the Strait of Hormuz, crude futures jumped above the $100 mark. This reaction was not surprising. When a corridor responsible for moving a significant portion of global oil flows is perceived to be at risk, the market wastes no time repricing that danger.
But beneath the rapid movement, something more structured was unfolding. Even during headline-driven chaos, price wasn’t acting randomly. It was moving toward areas where liquidity was concentrated. And as is often the case, the biggest spikes ended up trapping the traders who reacted the fastest.
WTI Crude Oil: Liquidity Trap Following Break Above Key Resistance
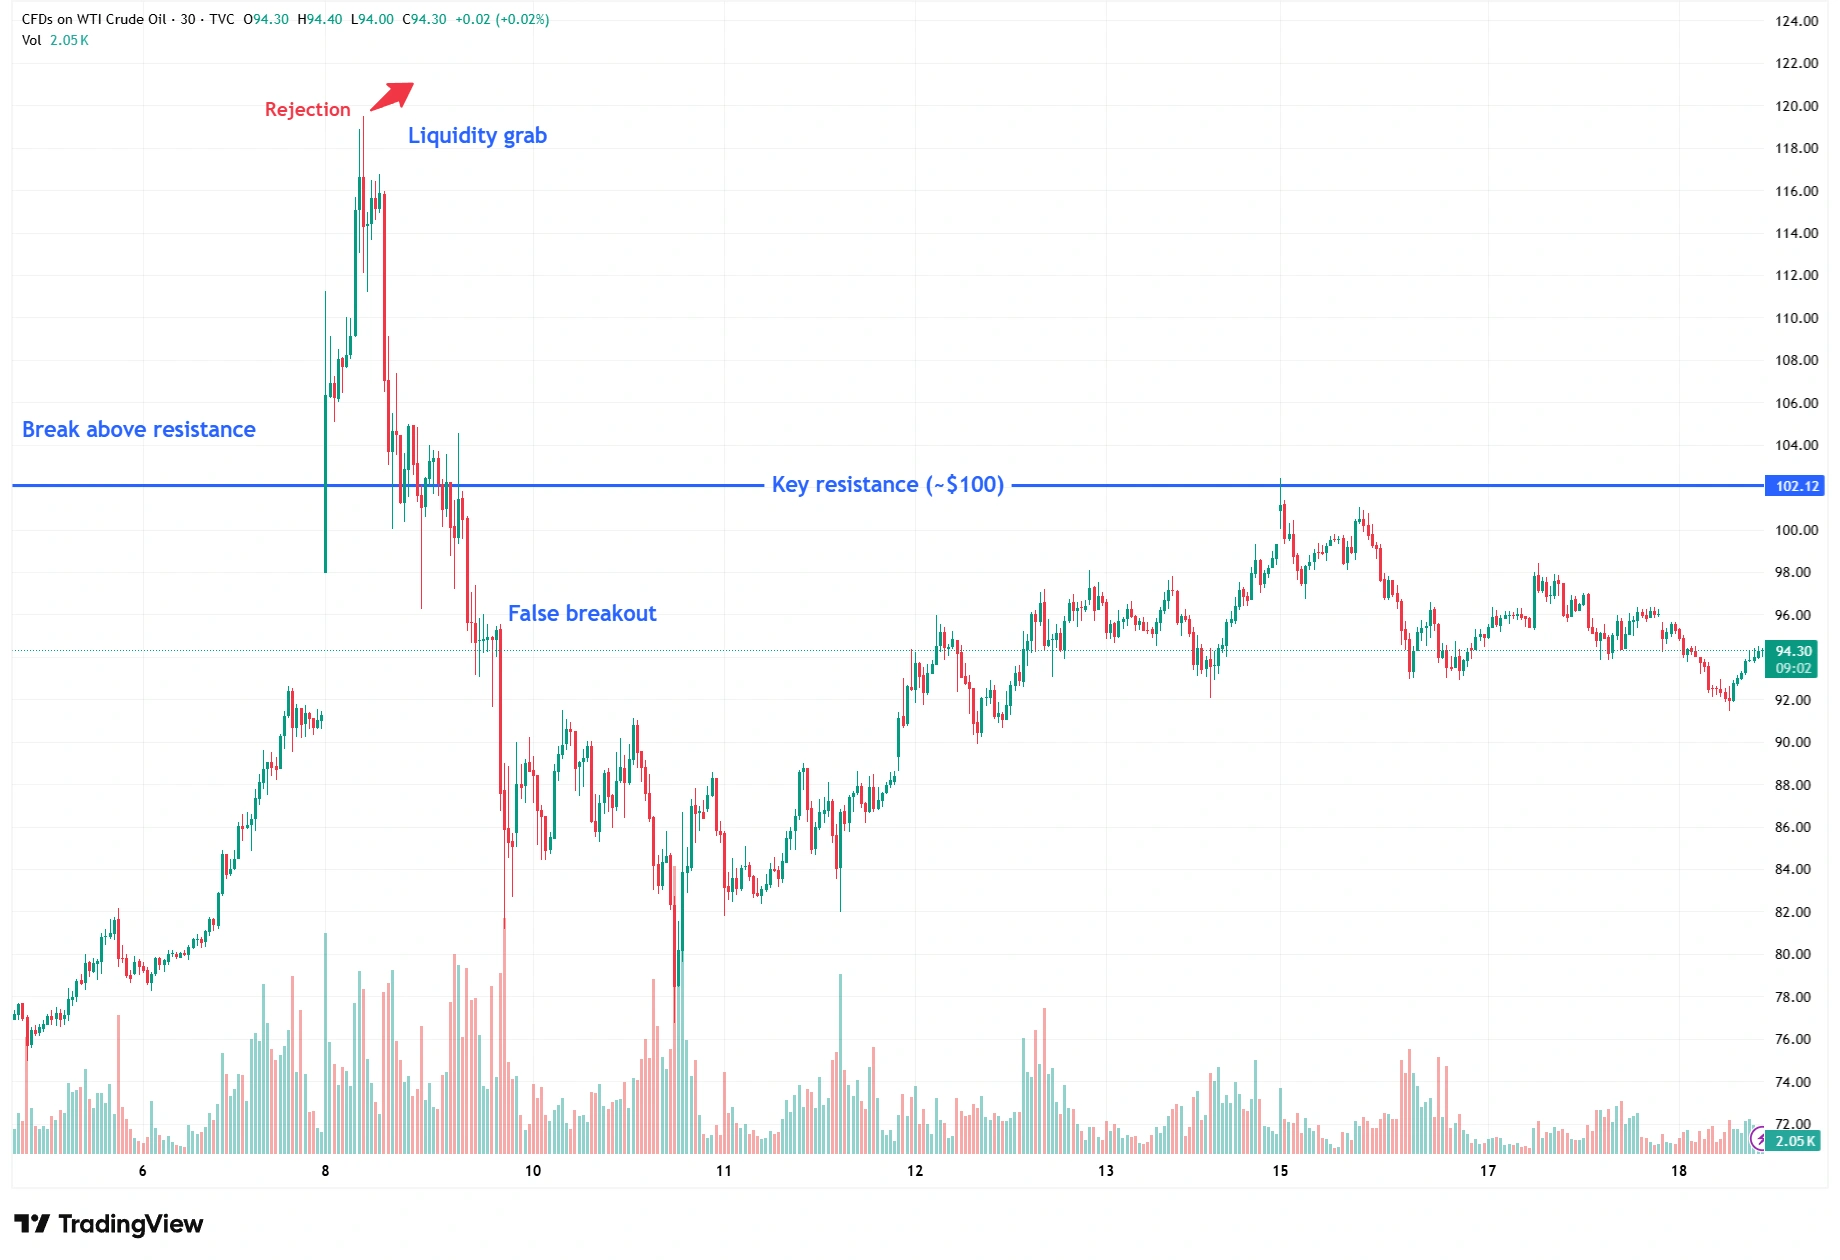
Source: TradingView. Past performance is not a reliable indicator of future performance. Data as of 18 March 2026.
Where Liquidity Builds in Oil Markets
Liquidity in oil tends to build around familiar areas: past swing highs and lows, well-defined range boundaries, prior zones of consolidation where positions accumulated, and, of course, the major round numbers that attract enormous order flow. These are the places where resting orders congregate, where stop-losses stack, and where breakout traders prepare to engage.
When volatility increases and liquidity thins out, these levels become even more influential. Price is drawn to them because that is where the bulk of orders sit waiting to be triggered.
WTI Crude Oil: Where Liquidity Builds Around Key Price Levels
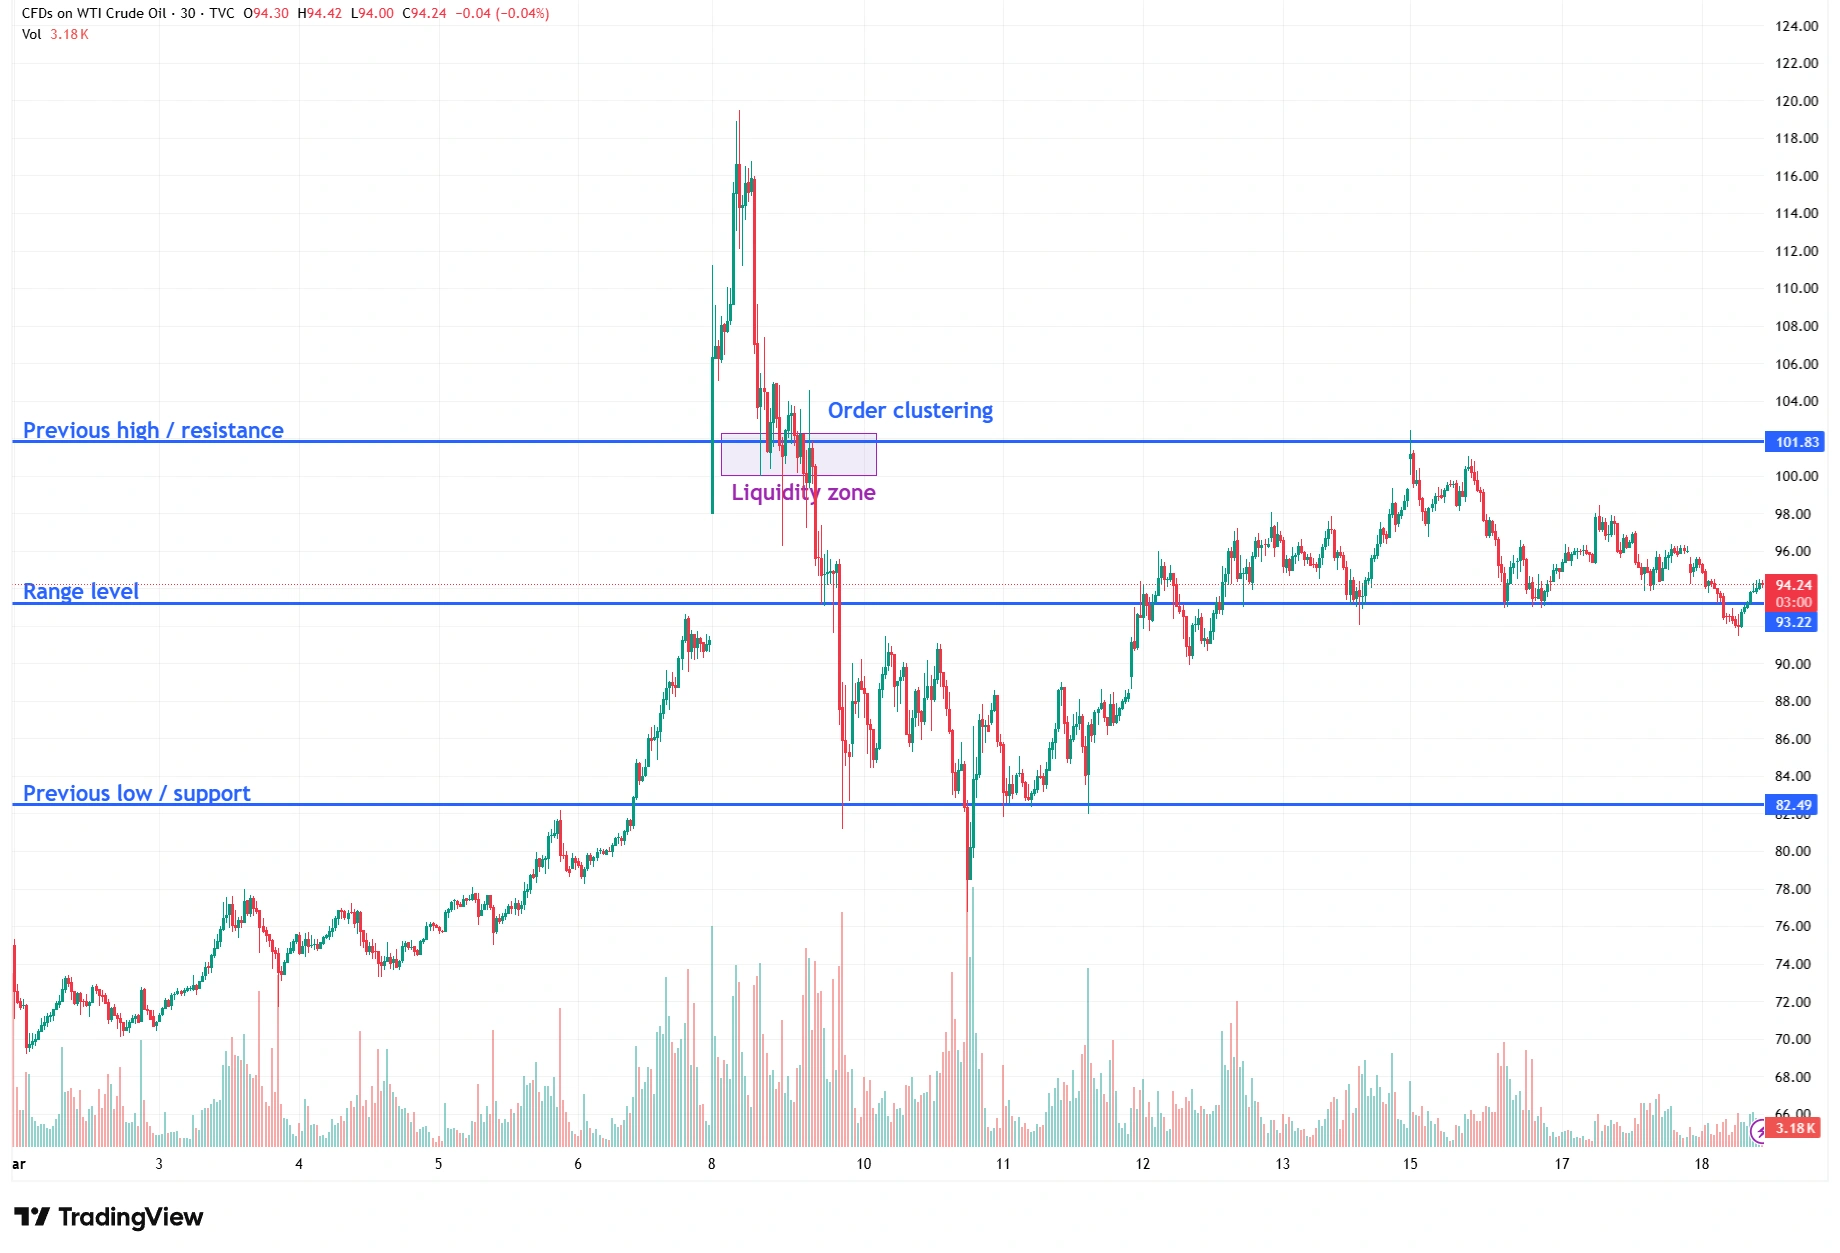
Source: TradingView. Past performance is not a reliable indicator of future performance. Data as of 18 March 2026.
When a Geopolitical Spike Becomes a Trap
This is why a headline-driven surge often looks like a genuine breakout at first glance. A sharp candle pushes through resistance or breaches a widely watched psychological level. Traders, feeling the pressure of a fast market, jump in expecting the move to continue.
But beneath the surface, something different is happening. The breakout is activating stops, triggering breakout entries, and releasing a rush of liquidity into the market. Larger players, who need liquidity to execute size without moving the market against themselves, often use these moments to fill opposing positions.
Once that liquidity is absorbed, the move fades. Price slips back beneath the level it had just pierced, and what looked like strength turns abruptly into weakness. The traders who chased the move are now holding positions at the worst possible price.
How to Recognise a Liquidity Trap
The signs of a liquidity trap are usually visible before the reversal becomes obvious. A break above a key level that closes back inside the previous range is one of the clearest warnings. The long wick shows that the market rejected higher prices and that buyers couldn’t maintain control.
If the next candle fails to provide continuation, or worse, moves in the opposite direction, the breakout becomes even more suspicious. Momentum indicators often confirm the story; when price pushes into new highs but momentum fails to follow, the move is usually running on temporary fuel rather than genuine strength.
During geopolitical volatility, rapid expansions in candle ranges also reveal a market dominated by forced flows and stop-runs rather than committed buying.
Why Traders Keep Getting Caught
Traders fall into these traps repeatedly because fast markets create emotional urgency. When oil surges on a headline, it feels like a once-in-a-moment opportunity. The fear of missing out leads many to enter impulsively, long after the smart money has already positioned.
Meanwhile, experienced participants do the opposite. They let price move into the liquidity. They watch how the market behaves at the level. And they wait for confirmation before acting.
They are not trading the headline. They are trading the reaction.
A More Structured Way to Approach Volatile Markets
A more reliable approach is to slow the decision-making process down. Whenever price breaks a significant level, the first question should always be whether it can hold there. Waiting for a proper close rather than reacting to an intraday spike reduces the noise created by volatility
Watching how price behaves on the retest reveals whether buyers or sellers are actually willing to defend the level. Position sizing must also reflect the environment, when volatility expands, the apparent distance between levels becomes deceptive.
Momentum tools can help contextualize the move, but they should supplement rather than dictate decisions.
Bottom Line
Oil will always react sharply to geopolitical developments. That part of the market is permanent.
But the behaviour of price around liquidity is just as consistent. Even in the most chaotic moments, the market respects the areas where orders are concentrated. Technical levels will never predict the next headline, but they can reveal how price is likely to respond once that headline hits.
And in many cases, that difference is what separates the traders who chase the spike from those who avoid the trap.