Ethereum vs Bitcoin: What Relative Strength Reveals About Crypto Trends
In cryptocurrency markets, Bitcoin often sets the overall direction, but Ethereum frequently plays an important role in signalling shifts in investor sentiment. While Bitcoin is widely viewed as the anchor of the crypto ecosystem, Ethereum tends to gain momentum when risk appetite strengthens across the market.
For this reason, traders often look beyond the price charts of individual assets and instead monitor the ETH/BTC ratio. This ratio shows how Ethereum is performing relative to Bitcoin by measuring how much Bitcoin is required to buy one Ethereum. When the ratio rises, Ethereum is outperforming Bitcoin. When it falls, Bitcoin is gaining relative strength.
Understanding this relationship can offer useful insight into broader market dynamics. Periods when Ethereum outperforms Bitcoin often coincide with stronger risk appetite in the crypto market, while phases where Bitcoin dominates can indicate more cautious positioning from investors.
Ethereum vs Bitcoin (ETH/BTC): Tracking Relative Strength in the Crypto Market
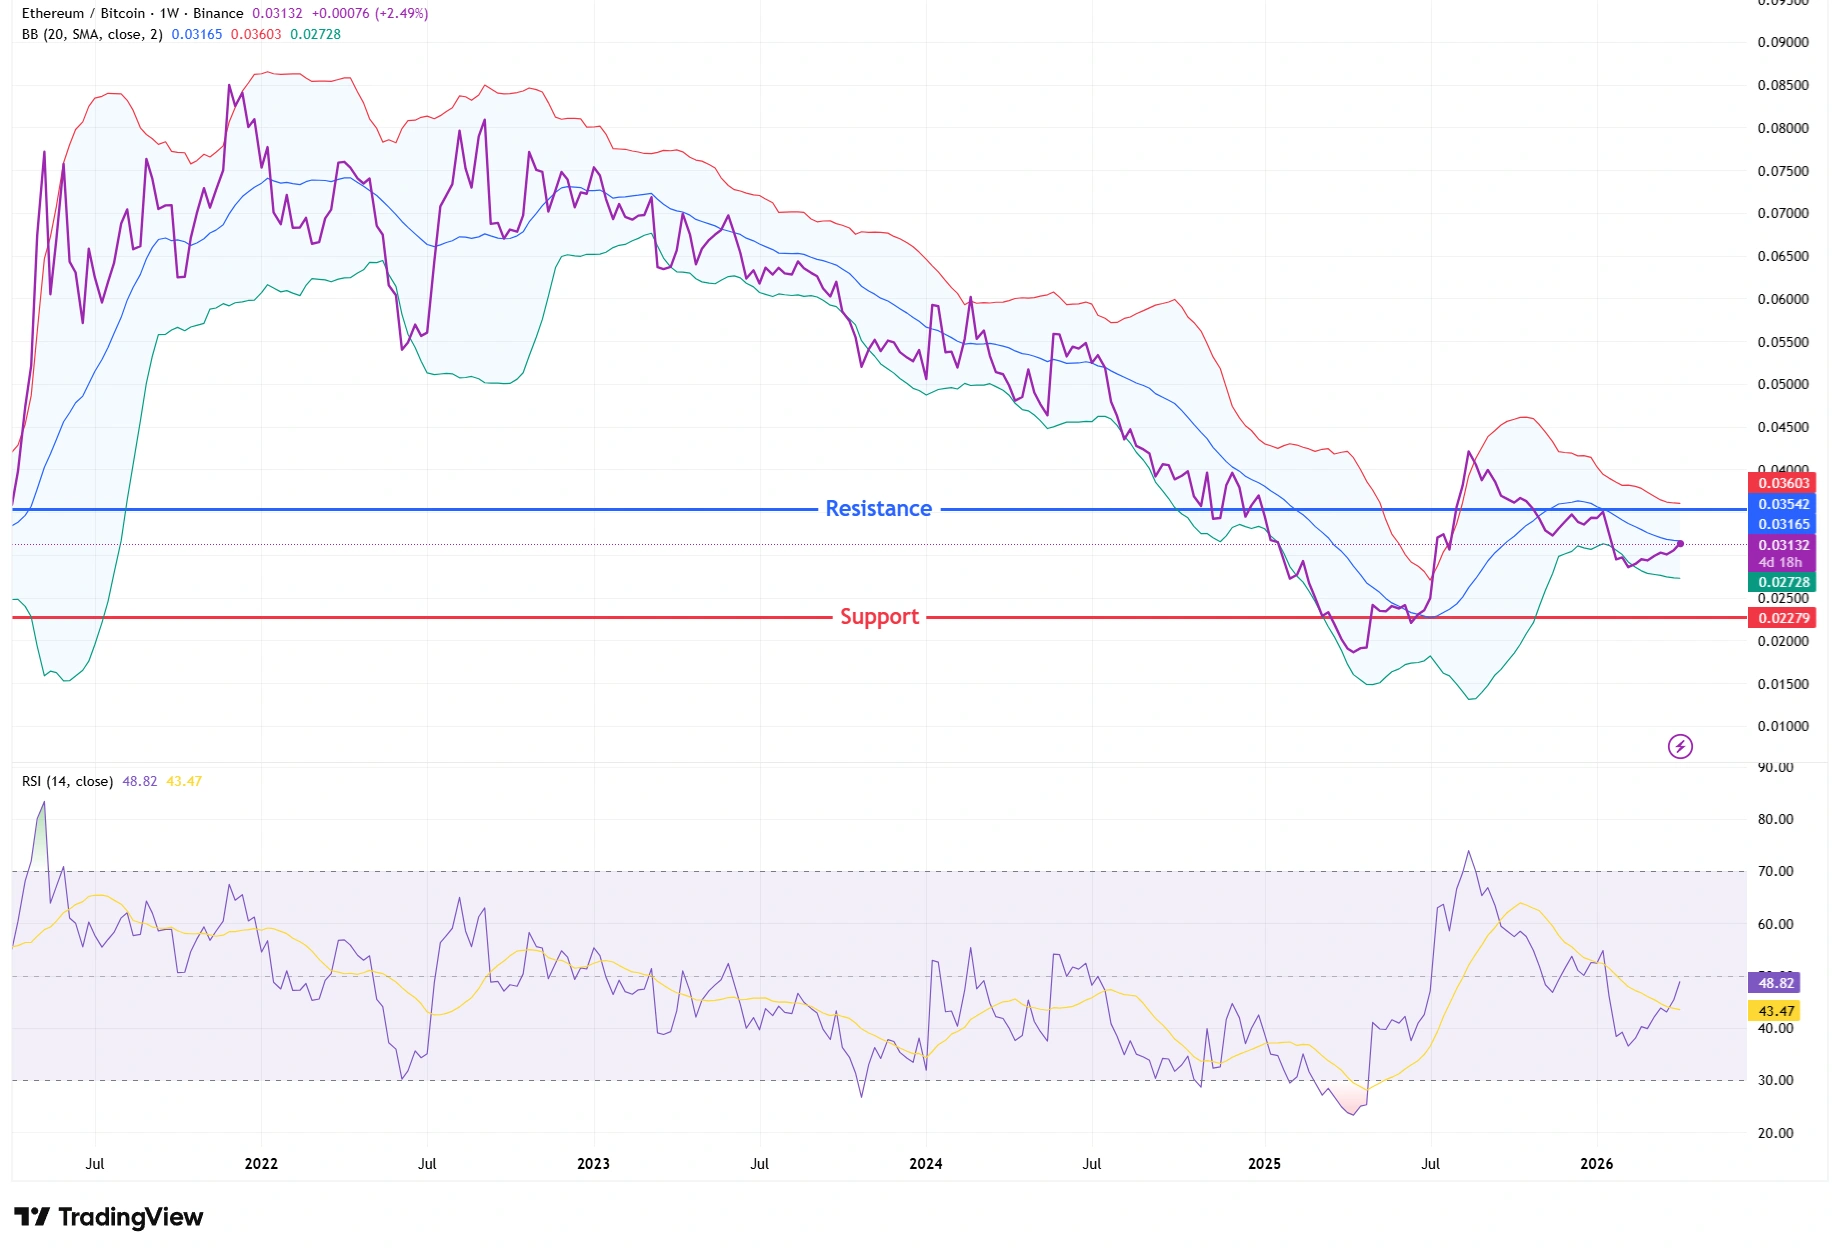
Source: TradingView. Past performance is not a reliable indicator of future performance. Data as of 8 April 2026.
The ETH/BTC ratio measures how Ethereum performs relative to Bitcoin. When the ratio rises, Ethereum is outperforming Bitcoin, which can signal stronger risk appetite across the cryptocurrency market. The chart shows the pair consolidating between support near 0.02 and resistance around 0.035 BTC after a prolonged downtrend.
Tracking Relative Strength Through the ETH/BTC Ratio
The ETH/BTC chart helps traders observe how leadership between the two largest cryptocurrencies evolves over time. Rather than focusing on absolute price levels, the ratio highlights which asset is attracting more capital.
Looking at the weekly ETH/BTC chart, the ratio has been in a broader downtrend since 2021, indicating a period where Bitcoin has generally outperformed Ethereum. However, recent price action shows the ratio stabilising within a consolidation range.
Support has emerged around the 0.02-0.025 area, while resistance is forming near 0.035. This range suggests the market is currently balancing between the two assets as investors assess the next phase of the crypto cycle.
From a technical perspective, traders often analyse several elements on the ETH/BTC chart:
- Support and resistance levels, which highlight where buying or selling pressure tends to emerge
- Trend direction, observed through higher highs and higher lows or the opposite pattern
- Moving averages, which can help identify longer-term shifts in momentum
If the ratio begins to form higher highs and higher lows, this suggests Ethereum is gaining strength relative to Bitcoin. Conversely, continued weakness in the ratio could indicate capital is rotating back toward Bitcoin.
Momentum indicators can provide additional context. For example, the Relative Strength Index (RSI) on the weekly ETH/BTC chart is currently hovering close to the neutral 50 level. This suggests that neither asset currently has a clear momentum advantage.
Bollinger Bands on the chart have also narrowed compared with earlier periods of volatility, which may indicate the market is entering a consolidation phase before its next directional move.
How Market Cycles Influence Ethereum and Bitcoin
The relationship between Ethereum and Bitcoin often reflects broader phases of the crypto market cycle.
Historically, Bitcoin tends to lead the early stages of bullish market conditions. As the most established cryptocurrency, it often attracts capital first when confidence begins to return to the sector.
As the rally develops and investor sentiment improves, capital frequently rotates into Ethereum and other digital assets. During these phases, the ETH/BTC ratio may begin to rise as Ethereum starts outperforming Bitcoin.
This pattern was visible during previous crypto cycles, including the 2017 rally and the decentralised finance expansion of 2020. In both cases, Ethereum began to strengthen relative to Bitcoin as the market moved deeper into the bullish phase.
More recently, both Bitcoin and Ethereum have shown similar performance patterns over the past year. Their price movements have broadly tracked one another, reflecting strong participation across the crypto market rather than leadership from only one asset.
Bitcoin vs Ethereum Price Performance
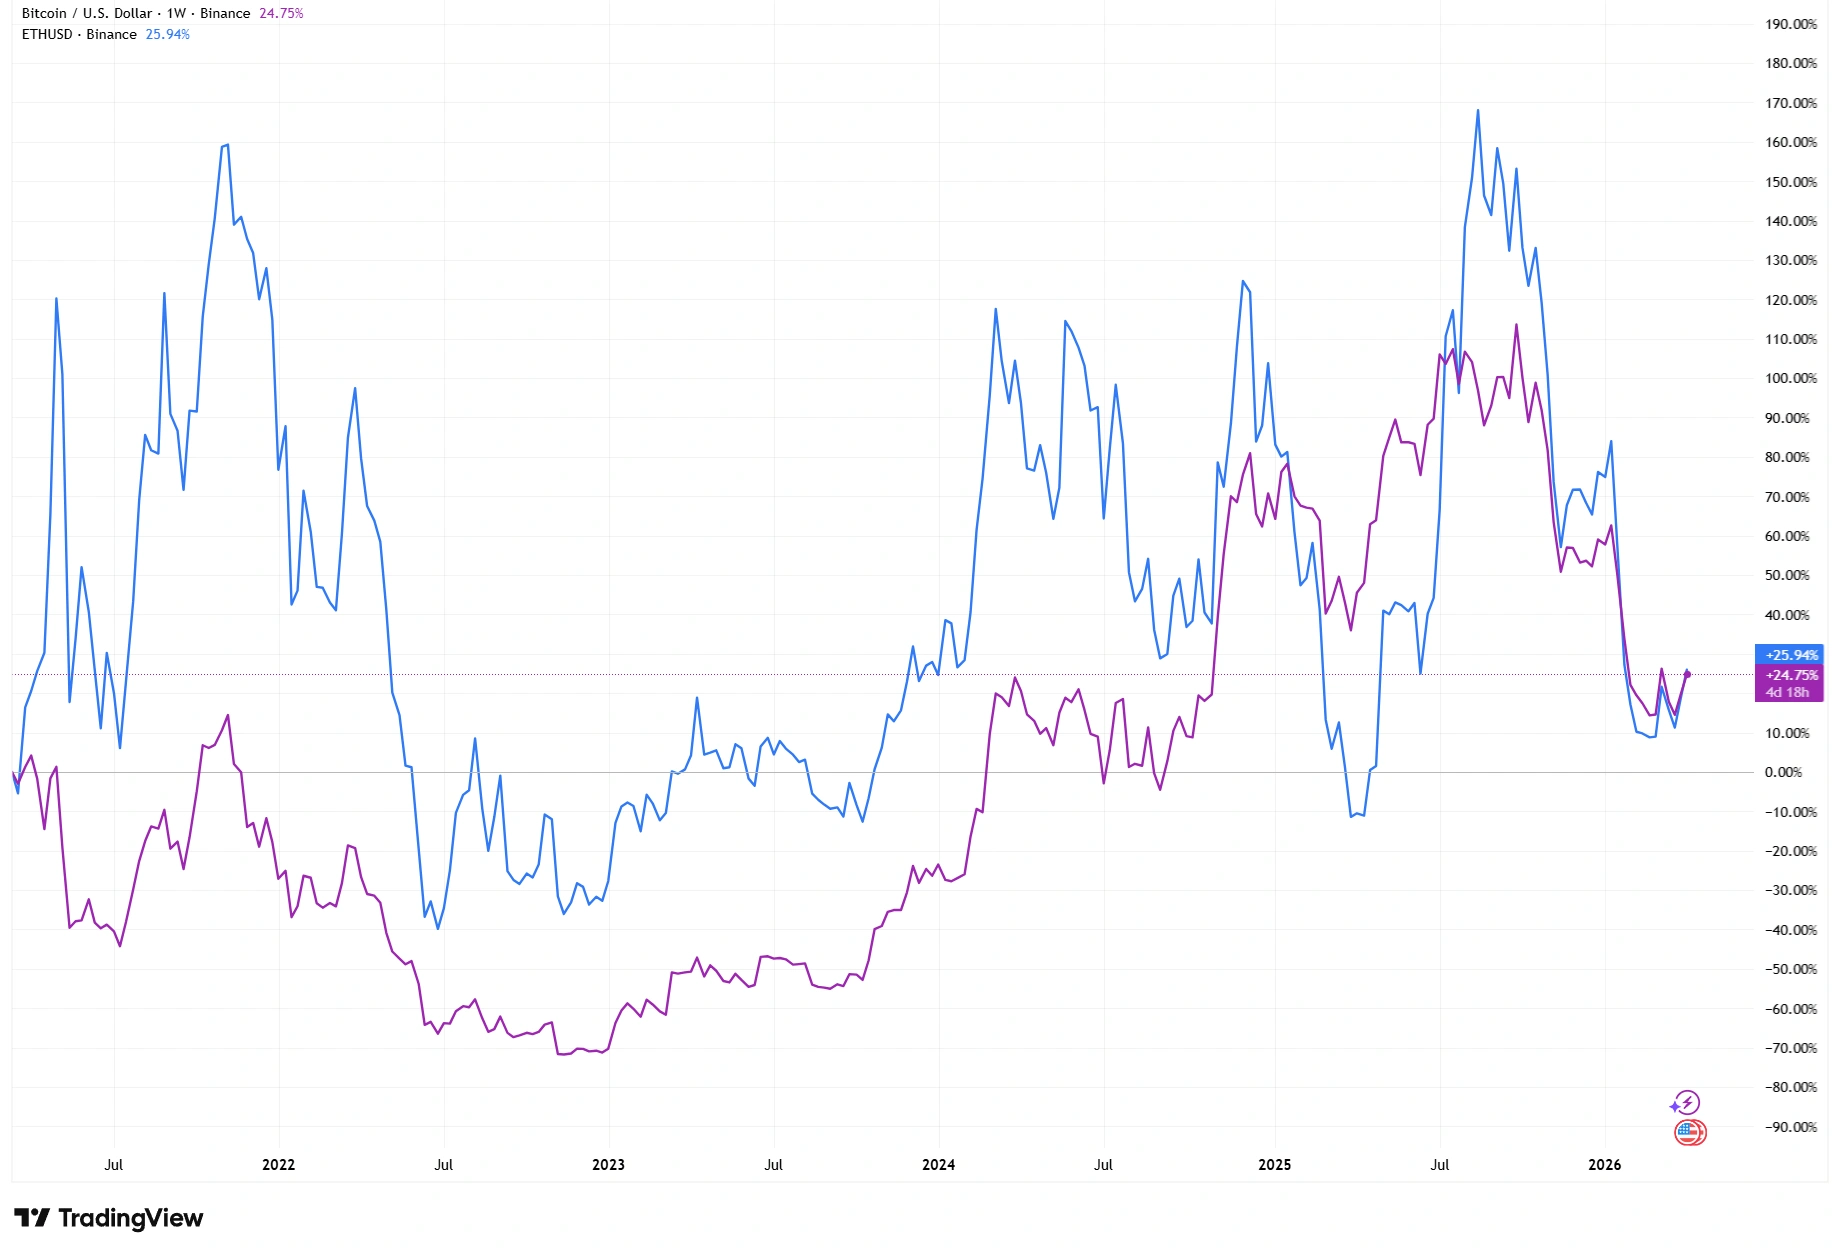
Source: TradingView. Past performance is not a reliable indicator of future performance. Data as of 8 April 2026.
Comparing Bitcoin and Ethereum price performance highlights how leadership can shift across different market phases. Bitcoin often leads early in market recoveries, while Ethereum may gain momentum as investor confidence strengthens and capital rotates across the broader crypto ecosystem.
By contrast, during periods of uncertainty or declining sentiment, investors often rotate capital back into Bitcoin. This can cause the ETH/BTC ratio to fall as traders favour the more established asset.
Why Relative Strength Matters for Traders
Relative strength analysis offers traders a useful way to understand changing market conditions. Instead of analysing each asset in isolation, the ETH/BTC ratio provides insight into how capital is moving within the crypto ecosystem.
A rising ETH/BTC ratio does not necessarily imply falling Bitcoin prices, both assets can rise, with Ethereum rising faster. Instead, the ratio reflects the relative pace of capital flowing into each asset.
A rising ratio can signal increasing risk appetite and broader participation across the digital asset market. A declining ratio may suggest investors are becoming more defensive and shifting toward Bitcoin.
For traders and market observers, monitoring the ETH/BTC chart alongside individual price charts can help reveal subtle changes in market behaviour.
While Bitcoin remains the central reference point for the cryptocurrency market, Ethereum’s performance relative to Bitcoin can provide valuable clues about sentiment, momentum and the potential direction of the broader crypto landscape.
As with any technical indicator, relative strength should be viewed as one tool among many. However, when combined with price analysis and broader market context, it can offer a clearer perspective on how leadership within the crypto market may be evolving.
Cryptocurrency markets are highly volatile and may not be suitable for all investors.