Trading Oil During Geopolitical Shocks: Reading the Move, Not the Noise
Before the Shock
For months, price lived in a tight band in the mid-70s to low 80s. Candles were small, RSI kept revolving around the middle, and MACD was calm. That is classic compression. Nothing dramatic, just a market waiting for a reason to wake up.
When the Headline Hit
The wake up was violent. Brent did not climb step by step. It repriced. On March 9, 2026, intraday prints in the global benchmarks reached as high as about 119 to 119.5 before fading, the sharpest levels since mid-2022. The driver was concentrated risk around the Strait of Hormuz, which typically carries about 20 million barrels per day of crude and petroleum liquids, roughly one fifth of global consumption and around one quarter of world seaborne oil trade. When that corridor is threatened, crude adds a risk premium fast.
What the Chart Actually Said
The candles shifted from quiet to vertical, which is pure shock repricing rather than trend. Price jumped past intermediate structure and reacted around the major brackets near 100 and above.
Brent Crude 2H Chart: Compression, Spike, and Reversal
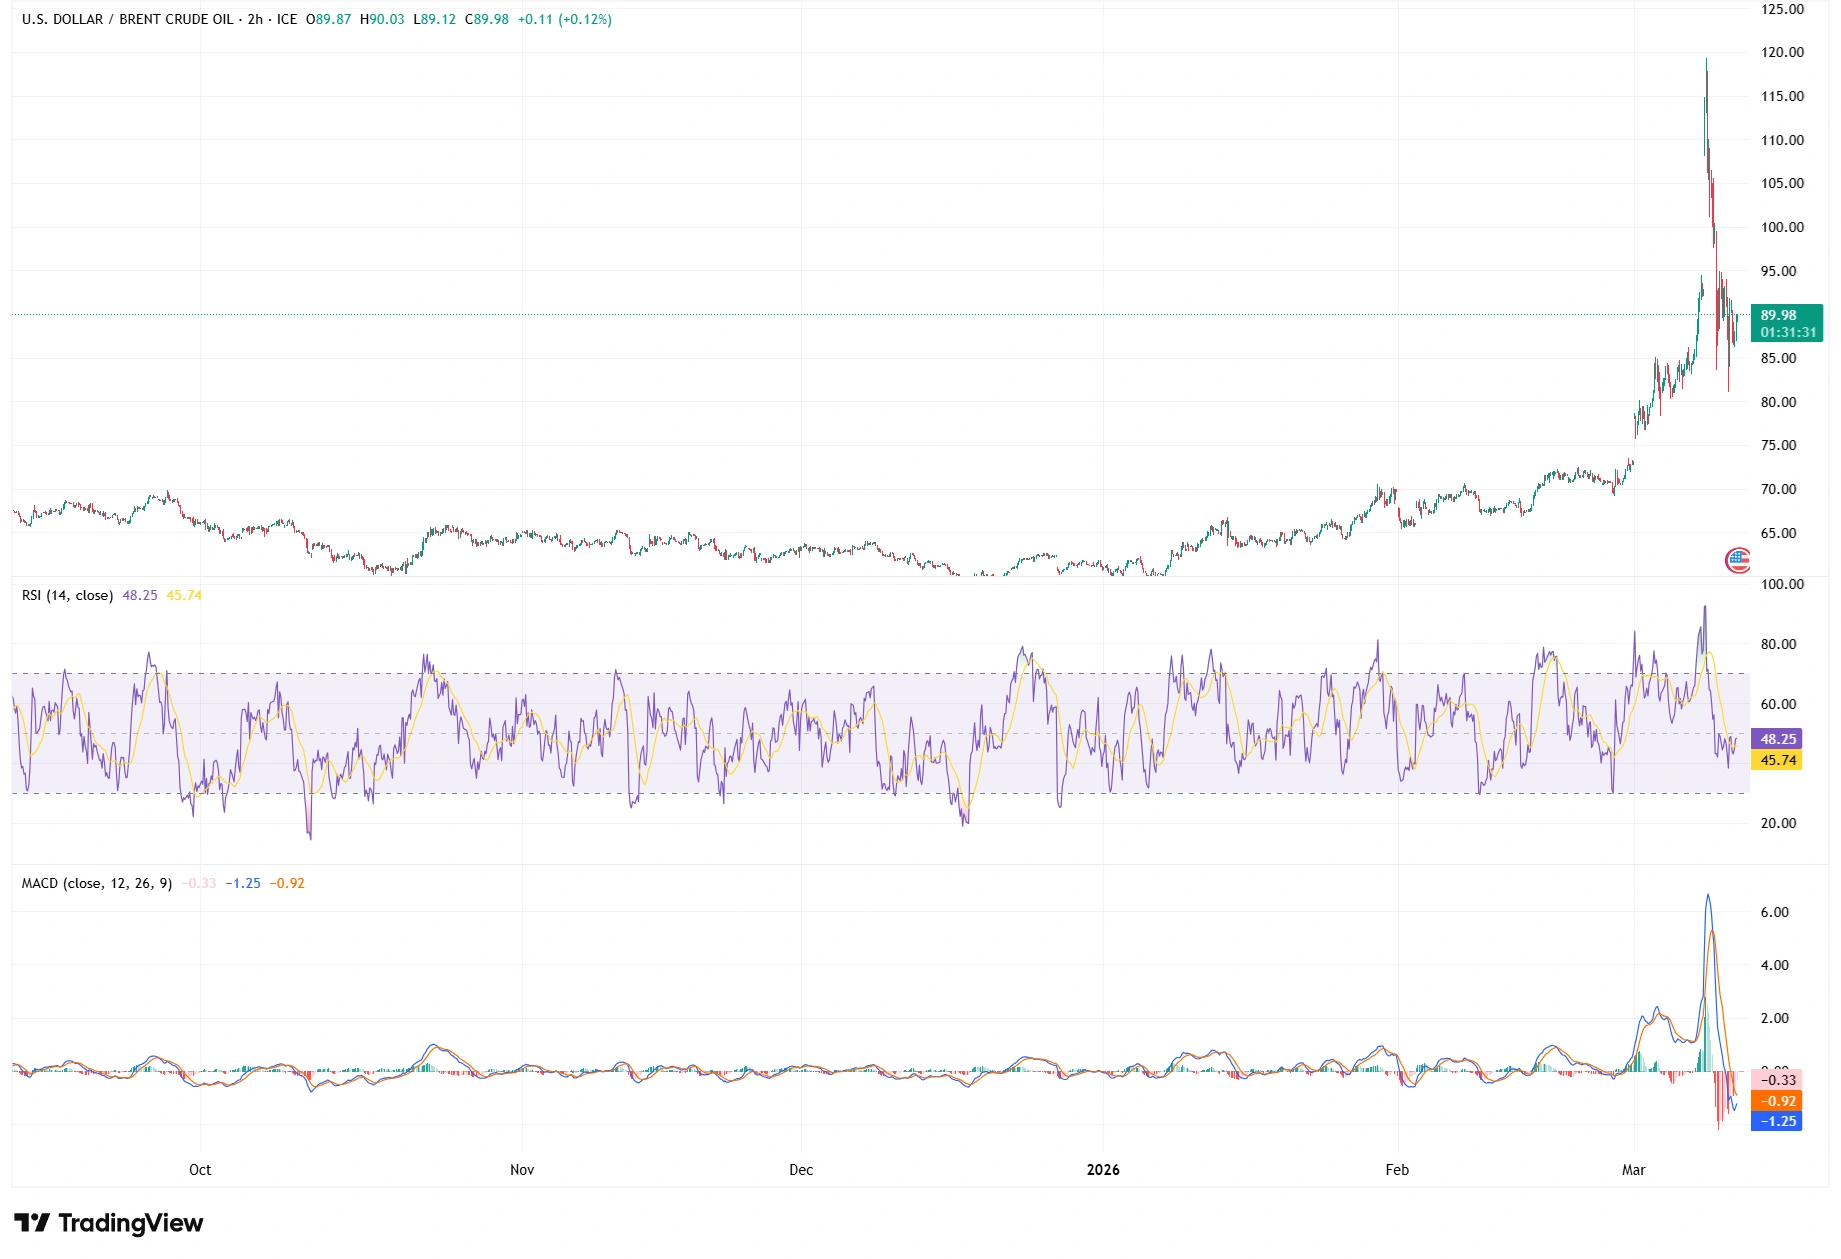
Source: TradingView. Past performance is not a reliable indicator of future performance. Data as of 11 March 2026.
RSI spiked and held because the market was pricing a sudden supply risk, not a normal trend move. The better signal came later when RSI rolled over while price failed to hold the breakout on a retest. MACD echoed the same idea, surging during the jump and then flipping quickly as follow through vanished. That quick contraction is typical of a headline move burning out.
There is also published evidence that crude often clusters around whole numbers, with round levels such as 100 acting as behavioural barriers and attracting concentrated order flow in short horizons. Brent in particular has shown barrier effects around 10 dollar increments in certain periods.
The Unwind and Why It Happened So Fast
Once the panic peak formed, price did not consolidate. It reversed. By late March 9 into March 10, benchmarks fell back into the 80s and 90s as emergency stock release discussions gained momentum. G7 conversations referenced a coordinated 300-to-400-million-barrel option, and IEA officials floated a proposal larger than the 182 million barrels released in 2022. Those headlines pulled crude off its highs quickly.
The chart reflected this shift clearly. Long upper wicks marked exhaustion, the breakout failed on the first pullback, and price slid straight through levels it had ignored on the way up. That is how fear premium unwinds when the market starts to believe supply can be stabilised, even if the underlying risk has not disappeared.
What the Structure Implies Next
This is the standard oil shock arc. Base, explosion, exhaustion, unwind, recalibration. If price cannot reclaim and hold above the first shelf it lost on the way down, it keeps bleeding premium until it finds the last zone where buyers truly committed. If it does reclaim that shelf and holds it on a clean retest, momentum can shift from reactive to controlled trend instead of another panic spike. What matters is how the candles behave around big brackets and prior swing levels, because that is where liquidity concentrates and intentions become visible. Brent’s path from the 70s in late February to intraday highs near 119 on March 9, then back into the 80s and 90s after policy headlines, shows the market trading the response and the disruption’s duration, not the first shock.
The Takeaway You Actually Trade
Geopolitics explains why price moved. The chart explains what happens next. The path here shows price still respects levels even in a war tape. The round numbers and recent swing boundaries matter because that is where orders cluster and decisions are forced. If corridor pressure around Hormuz eases or stock releases materialise in scale, expect mean reversion toward the pre shock regime. If shipping remains constrained and policy offsets under deliver, expect the 100 to 110 brackets to stay active.