Oil: What Changed, Why Prices Jumped, and What Comes Next
Oil prices surged at the start of March as tensions in the Middle East escalated and disrupted one of the world’s most important energy routes.
Brent crude briefly climbed toward the mid-$80s, with an intraday high near $82.37 on March 2 and a settlement around $81.40 the following day, marking the strongest stretch since early 2025. The rise did not come from a shortage of oil in storage; in fact, US crude inventories increased by nearly 16 million barrels in the latest weekly report, a number that would normally push prices lower. Instead, traders focused almost entirely on what was happening in the Strait of Hormuz, a narrow shipping corridor that usually carries about one-fifth of global oil.
Reports of attacks, rising insurance costs and ships avoiding the area led the market to price in the possibility that oil might not move through the region safely.
Shipping Disruptions and the Risk Premium
The shift in tone was driven by logistics and security concerns rather than simple supply and demand. Several insurers temporarily reduced or suspended war-risk coverage for ships traveling through the strait, and some tanker routes were delayed or diverted. This sort of disruption immediately raises the cost of moving oil and increases the chance of temporary supply bottlenecks. In these moments, the market tends to react quickly, pushing prices higher until there is clarity on whether ships can safely pass through the region. Even though the physical availability of oil had not yet changed dramatically, the fear of what could happen was enough to drive prices upward.
Technical Breakout and Momentum Signals
On the charts, price has pushed decisively above the $73-$74 ceiling that capped February, turning that zone into support and accelerating into the low‑$80s. The candles are printing well above the 50‑ and 200‑day simple moving averages, which sit in the mid‑$60s on this chart, confirming a clear separation from the prior range and a stronger uptrend. The expansion in real bodies and the pick‑up in volume at the right edge reinforce that the break was driven by active buying rather than a slow grind. The setup is straightforward: as long as pullbacks hold above the breakout area and price remains north of both moving averages, the path of least resistance stays higher.
Brent Crude (Daily): 50-day and 200-day SMA, RSI elevated, MACD positive
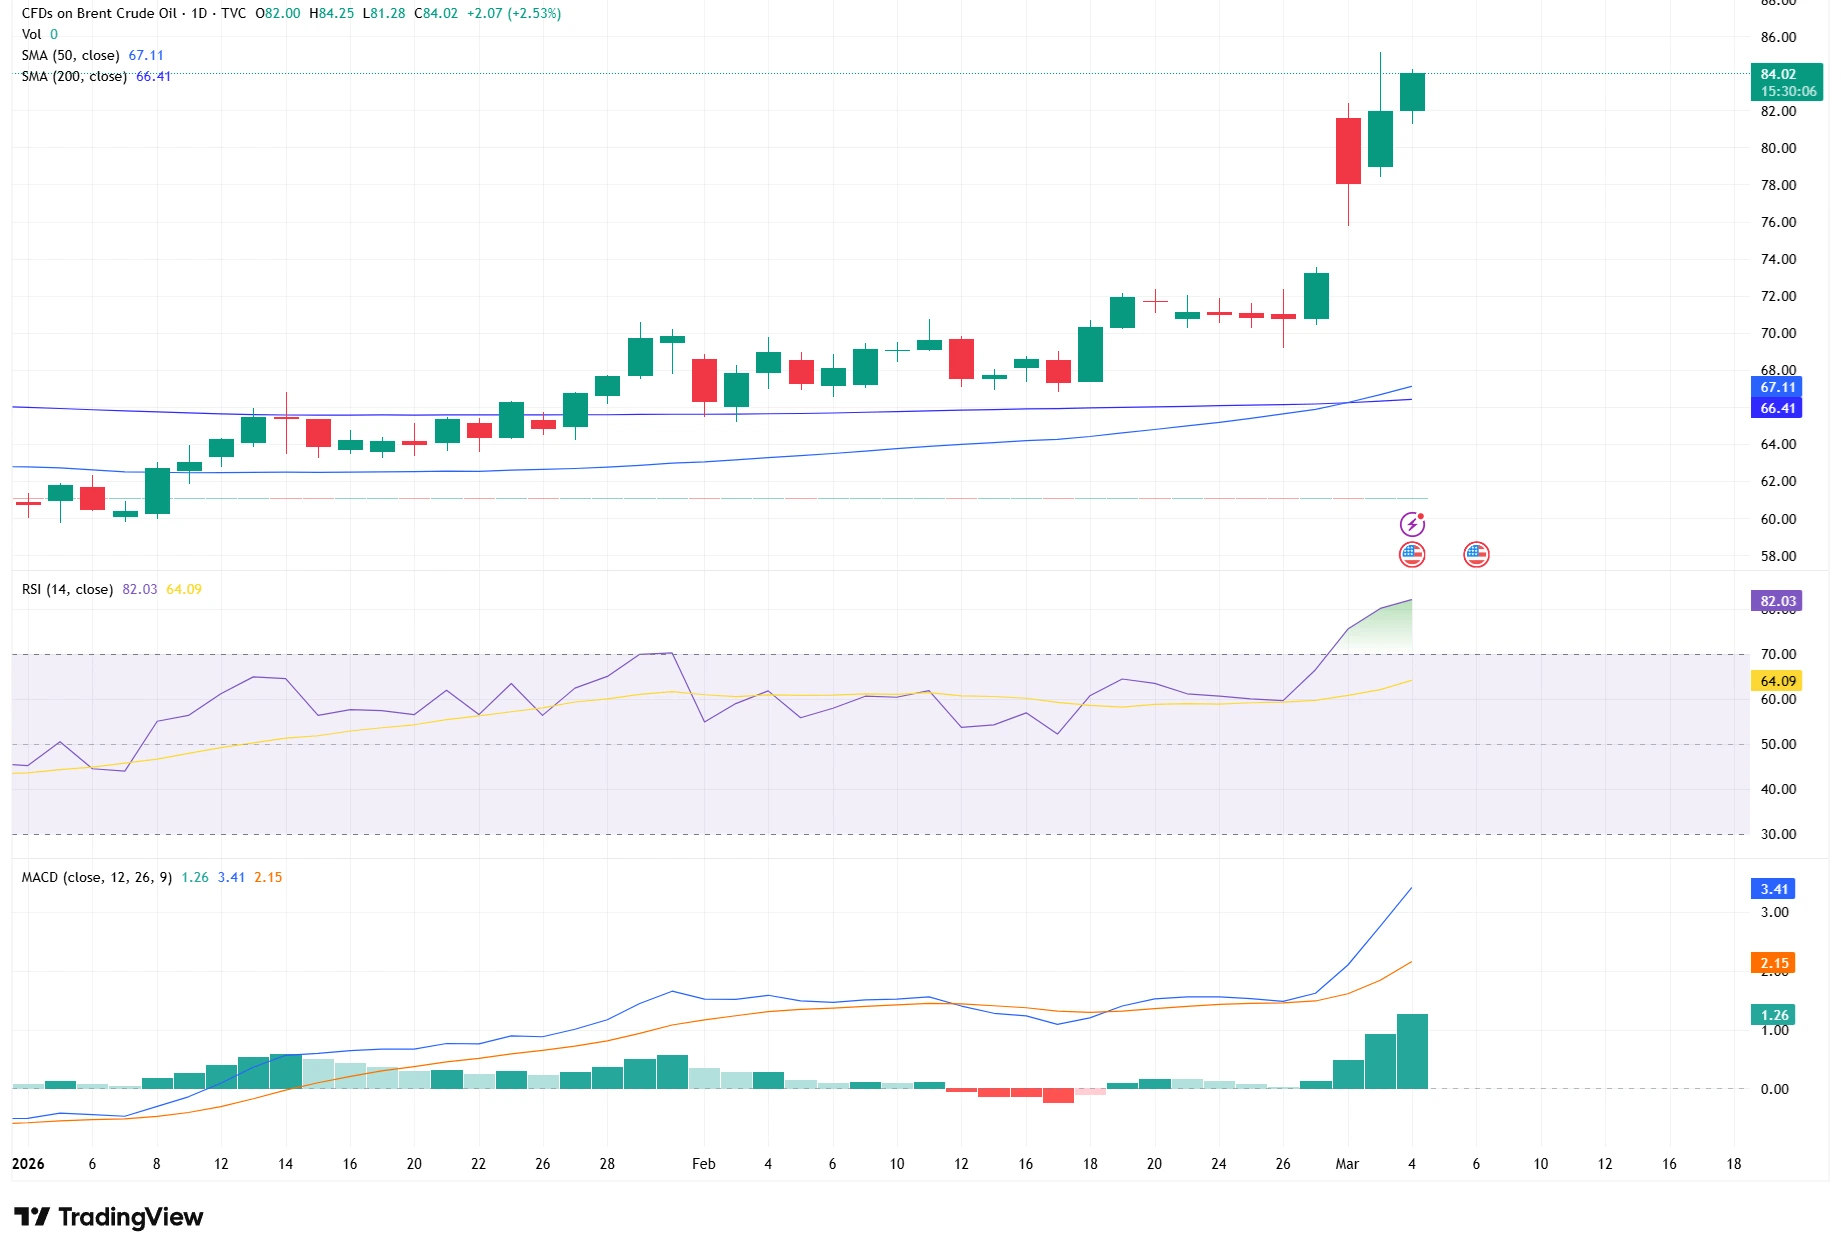
Source: TradingView. Past performance is not a reliable indicator of future performance. Data as of 4 March 2026.
Momentum confirms the move but also explains the choppiness. The 14‑day RSI is in the mid‑60s, close to, but not yet through, the typical overbought threshold of 70, so the market has run fast enough to be sensitive to short, headline‑driven dips. At the same time, MACD is firmly above the zero line with the MACD line above its signal and a widening positive histogram, which is what you expect to see when buyers remain in control. In plain terms: trend up, momentum strong, and any near‑term pullbacks are more likely to be pauses than reversals while the chart continues to respect the new support created by the breakout.
What Markets Are Watching Next
Much now depends on how shipping conditions evolve. If insurers restore normal coverage, and tankers feel safe returning to the Strait of Hormuz, the extra risk priced into oil could begin to fade. If tensions escalate or shipping restrictions remain in place, the higher pricing environment is likely to persist.
There is also the broader question of regional supply. Reports have already highlighted disruptions and concerns around production in parts of the Middle East, including Iraq, which could add further support to prices if they continue.
Policymakers are watching the situation closely, and any moves by the United States or its allies to provide protection or financial support for tanker traffic could help ease concerns and cool the market.
The Broader Global Impact
The rise in oil prices also carries global implications. Higher energy costs can push inflation upward, creating challenges for central banks that were previously leaning toward cutting interest rates. The impact is especially severe for countries dependent on Middle Eastern crude. India is one of the most exposed, sourcing about 55% of its oil from the region. As prices climbed, Indian-related equity markets softened, reflecting the concern that higher energy costs could weigh on growth. This sensitivity will remain as long as Middle East supply risks dominate the market narrative.
Key Levels Traders Are Monitoring
In the near term, traders are watching how oil behaves around current levels. The ability to stay above the high-$70s would suggest that the market is holding onto its recent gains. A drop back toward the low-$70s, particularly below the breakout area around $73-$74, would indicate that the rally is losing conviction.
On the other hand, a stable move above the mid-$80s would signal that buyers remain firmly in control and that the risk premium tied to conflict and shipping concerns is still active. The situation remains fluid, and markets are likely to react quickly to any changes in geopolitical headlines, shipping conditions or policy statements.
The Bottom Line
Oil’s recent surge is not about running out of supply. It is about uncertainty. As long as the Strait of Hormuz remains a point of tension, prices are likely to stay elevated and volatile. Should the situation stabilize, much of the extra “fear-pricing” could unwind just as quickly as it appeared. For now, the trend remains upward, supported by caution, geopolitics and a market that is highly sensitive to any disruption in one of the world’s most critical oil routes.