Nasdaq 100’s High‑Tight Flag: Healthy Continuation or Exhaustion?
What’s a high‑tight flag — in simple terms? It’s when prices sprint higher (that’s the flagpole), then catch their breath in a tight, shallow range near the top (the flag) before trying to push higher again. In practice, you’re looking for a strong run, only a small pullback (roughly 10-25% or less), and signs buyers still have the upper hand.
The Nasdaq 100 rallied back toward its late‑2025 record area and, since late January, has been moving in a tight range. It’s trading around the mid‑25,000s, just under the recent peak near 26,165, basically a brief pause close to the highs that looks like a flag forming.
Why the setup can move fast: A handful of mega‑cap tech names still do most of the heavy lifting. When those leaders move together, the whole index can jump, or give back ground, quickly. That concentration means any breakout from this range can travel further than you might expect.
Nasdaq 100: Uptrend, Pause Near Highs, and Key Averages
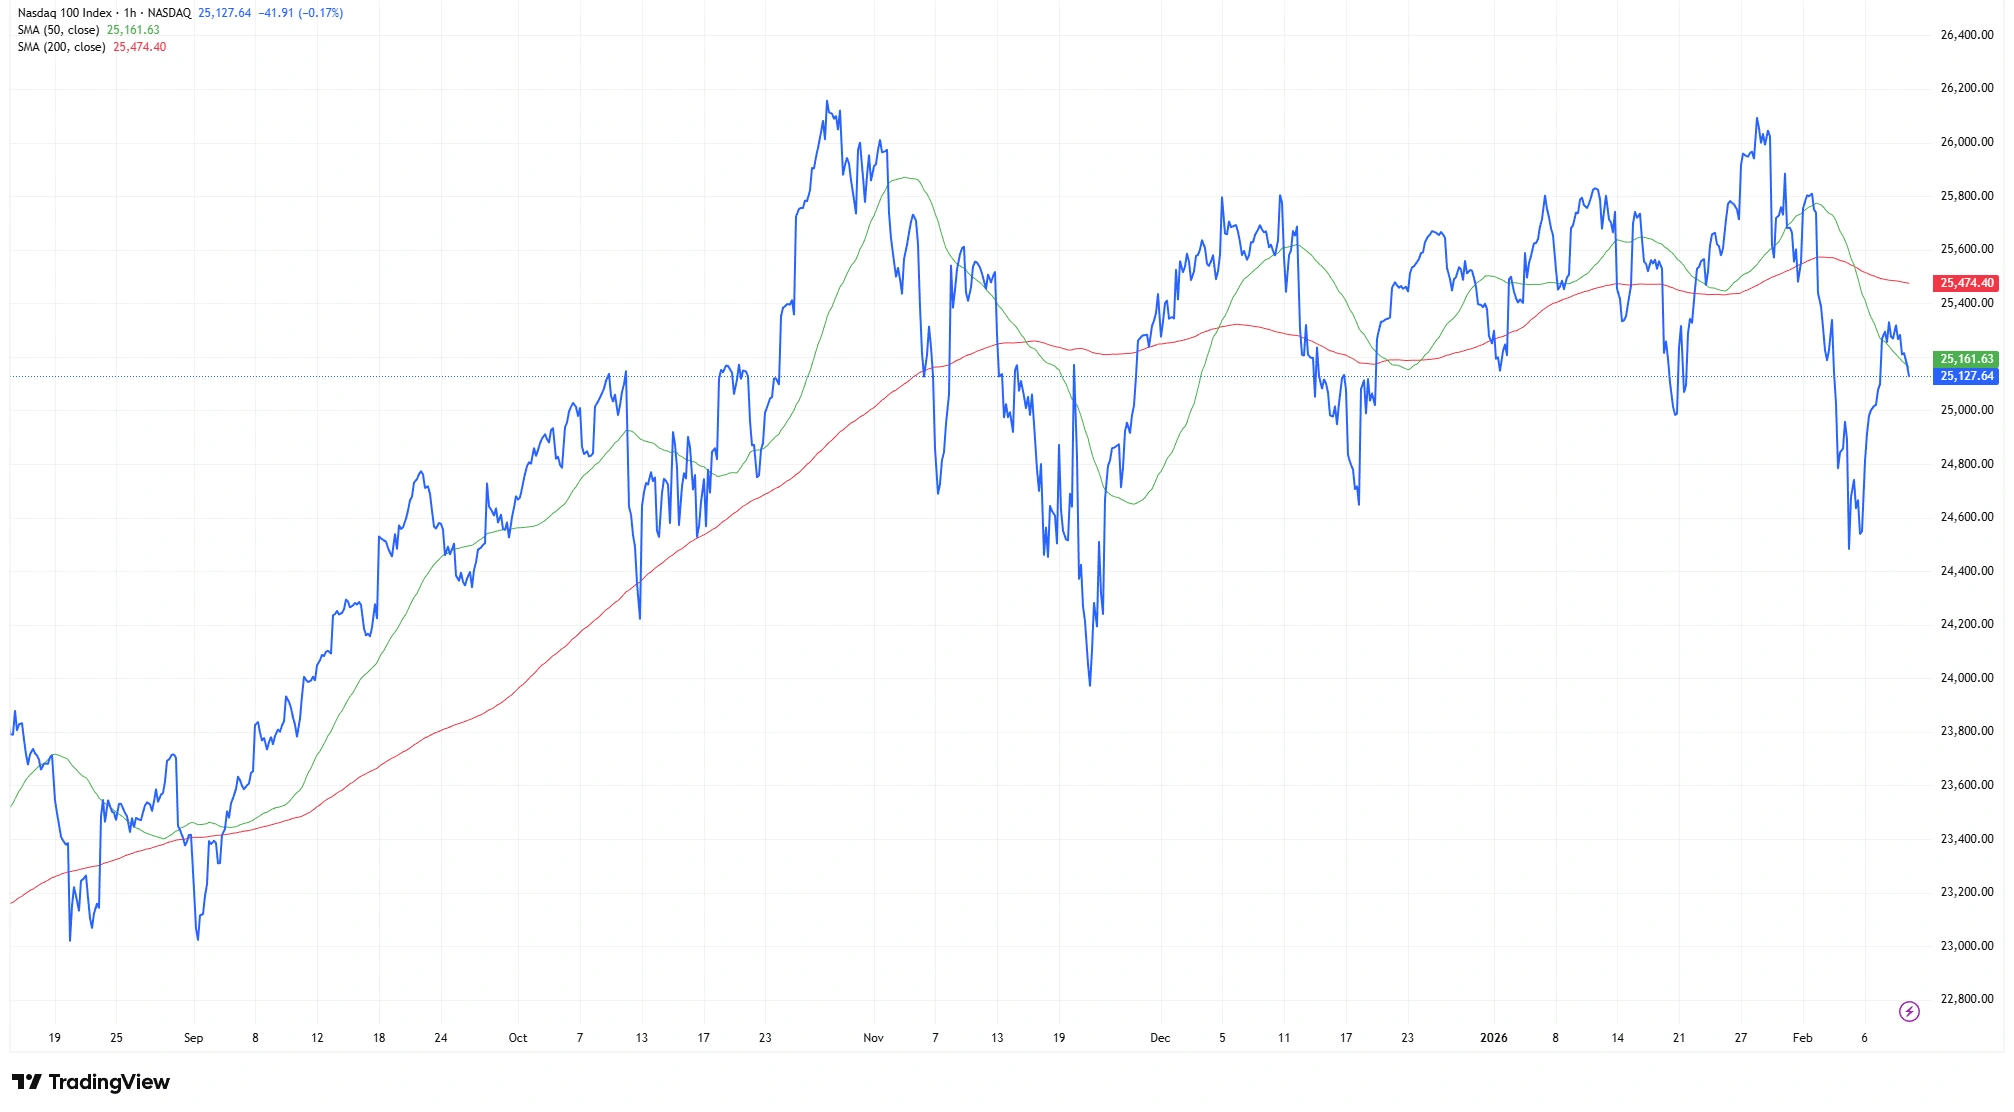
Source: TradingView. All indices are total return in US dollars. Past performance is not a reliable indicator of future performance. Data as of 11 February 2026.
The index is holding in a tight range near the highs while the 50‑ and 200‑day averages converge-typical “catch‑the‑breath” behaviour ahead of a bigger move.
Current Market Context
Policy path. The Fed kept rates at 3.50%-3.75% in January and guidance points to a slower, data‑dependent easing path through 2026, supportive for risk assets but a reminder that each inflation or jobs print can spark sharp price reactions.
Earnings season. Q4 results and guidance from large‑cap tech remain a swing factor; strategists still see tech as a key driver of 2026 profit growth, but surprises versus “whisper” expectations can quickly re‑price momentum structures.
Markets often stay quiet before big announcements, then break sharply afterward. That’s typically when a flag setup is either confirmed or invalidated.
The Technical Picture
- Pre‑move and range: From the October 2025 high near 26,182 to the late‑January retest around 26,165, the overall uptrend stayed intact. Buyers continued stepping in above the 24,600-24,900 area, which helped keep the index trading in a relatively tight zone near the highs.
- Consolidation quality: Since late January, the Nasdaq 100 has been moving in a steady, narrow range around the mid‑25,000s. This kind of calm, sideways action is common when the market is simply “catching its breath” after a strong run. Several tracking tools still show a generally neutral‑to‑positive outlook, which fits with a market preparing for its next move.
The Flag‑Like Range: 25,900-26,200 Resistance vs. 24,900-25,100 Support
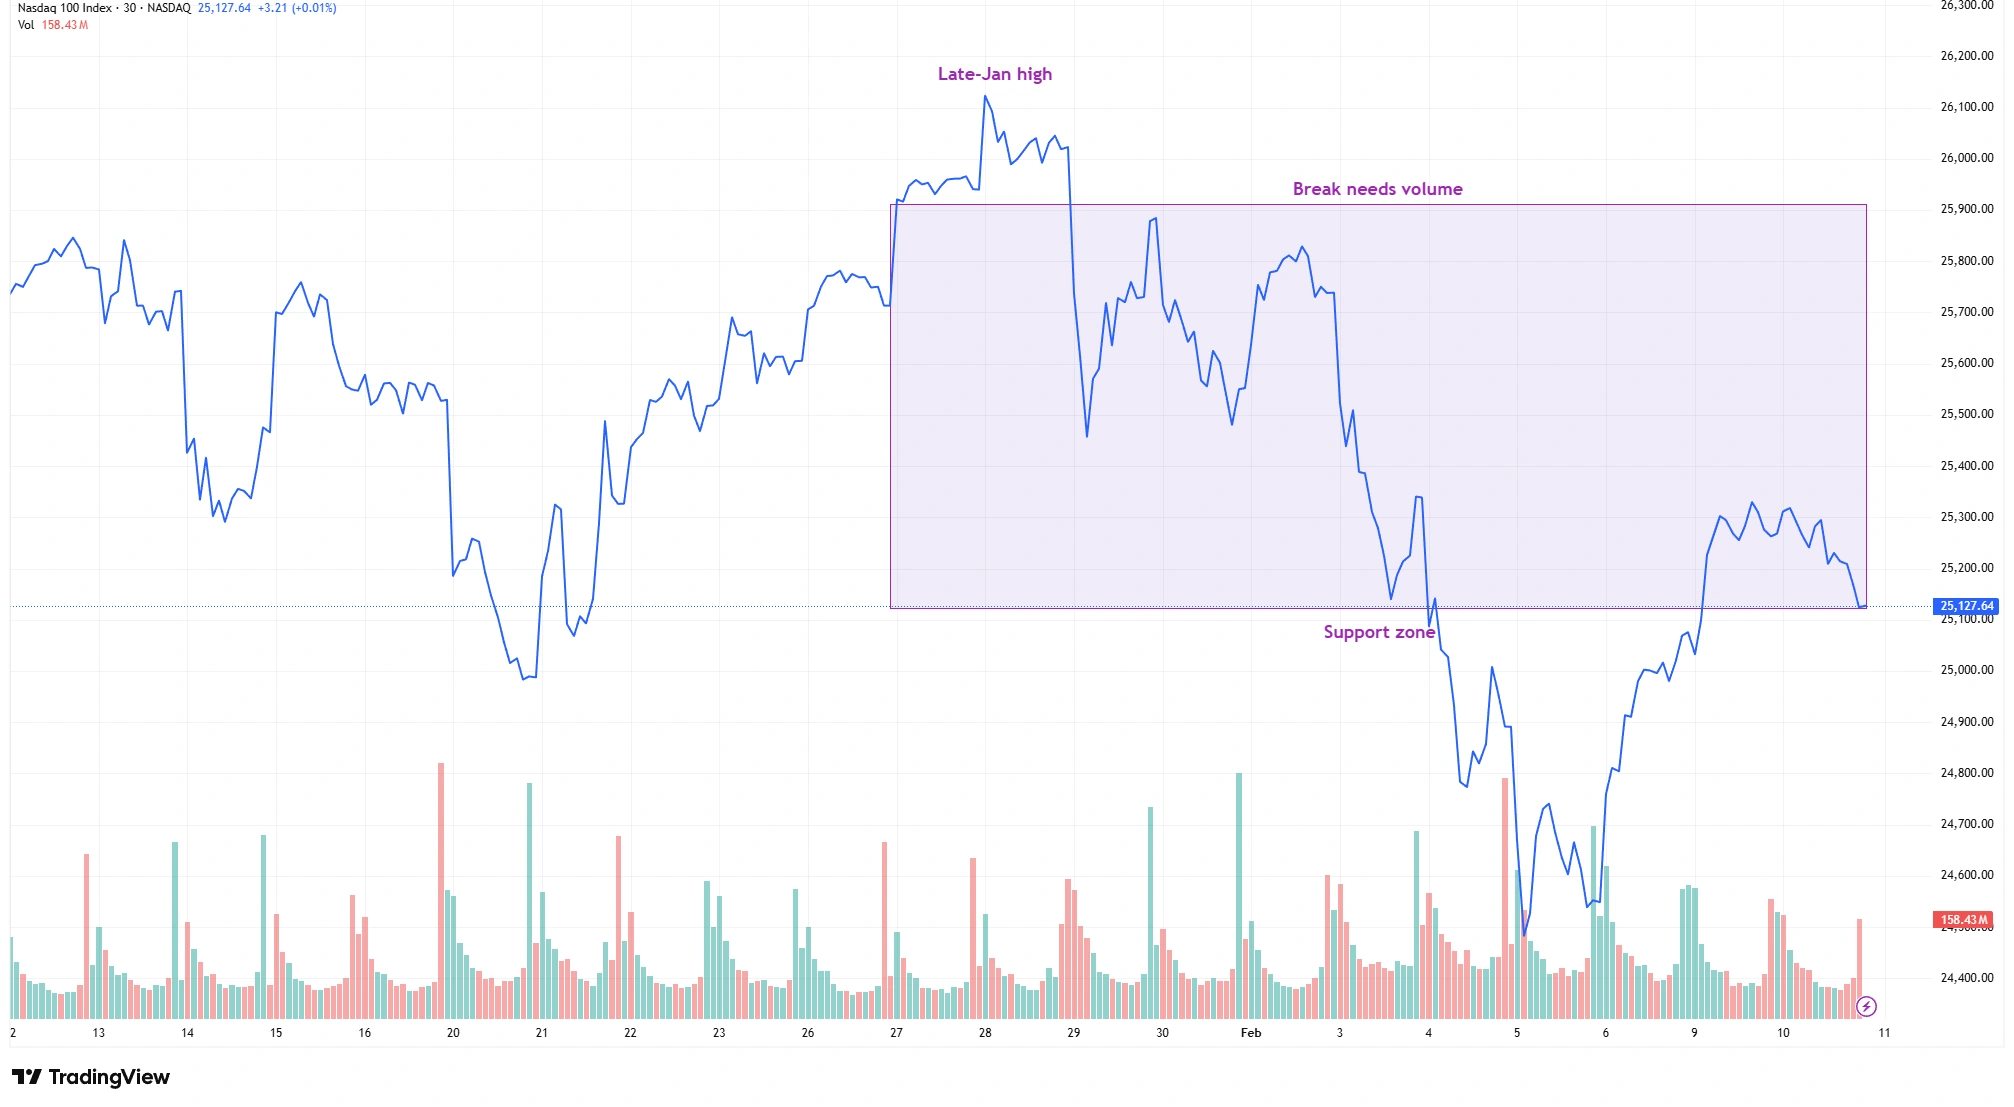
Source: TradingView. All indices are total return in US dollars. Past performance is not a reliable indicator of future performance. Data as of 11 February 2026.
Price has coiled below resistance (25,900-26,200) while dip buyers defended the 25,000 area. A clean break above the range with stronger volume would confirm continuation.
- Volume focus: In setups like this, traders usually watch whether volume increases when price starts moving out of the range. Quiet volume inside the consolidation is normal, but a pickup when breaking out is often a sign that the move has real strength.
- Momentum: Recent RSI readings are sitting in the mid‑40s to upper‑50s, which basically means the market isn’t overheated or exhausted. There’s still room for momentum to build if the index pushes higher. Traders will watch for the RSI to rise without creating a bearish divergence.
- Trend anchors: The 50‑day moving average is about 25,431, and the 200‑day moving average is roughly 25,449. With both averages sitting this close together, it shows the market has been moving sideways long enough for the short‑term and long‑term trends to almost meet. Staying above these levels helps keep the short‑term outlook constructive, while slipping below them, especially with rising volatility,would suggest the index may need a deeper reset before attempting another move higher.
- Key levels: Short‑term resistance sits just below the old highs at 25,900–26,200, while support is found between 24,000-24,600. These levels are widely watched and help frame what the index needs to clear, or hold, next.
Scenario 1 – If the Uptrend Continues
The bullish case strengthens if the Nasdaq 100 can push above 25,900-26,200 with stronger volume.
Ideally:
- RSI moves toward the mid‑50s to mid‑60s without negative divergence
- MACD starts turning upward
- Participation widens beyond just a few mega‑caps
All of that, paired with steady macro conditions (no hawkish surprises and reasonable earnings guidance), would support continuation.
Momentum Setup: RSI Mid‑Range, MACD Close to Turning
Source: TradingView. All indices are total return in US dollars. Past performance is not a reliable indicator of future performance. Data as of 11 February 2026.

RSI sits mid‑range (room to run) and MACD is close to turning higher; a new high without bearish divergence would strengthen the bull case.
Scenario 2 – If the Pattern Starts to Fail
Red flags appear if:
- Price retests the highs but momentum weakens (bearish divergence)
- Breakouts fail and price closes back in the range
- Rallies happen on weak volume, while selling comes with heavier volume
- Day‑to‑day volatility creeps up without real progress
- Leadership gets narrow again, relying on only a few large tech names
Those signs would increase the chances of a pullback toward 24,000-24,600, or even a test of the 50-day average, before any renewed attempt higher.
Key Levels to Watch
- Resistance (flag top): 25,900-26,200 (prior swing‑high/record zone).
- First support (flag base / retest): ~24,900-25,100.
- Secondary support (range floor): ~24,000-24,600.
- Trend references: 50‑DMA ~25,450; 200‑DMA ~23,740.
Trader Takeaway
- Breakout traders: consider staged entries on a decisive close above the range with volume, using the breakout day’s low as a clear invalidation. Be mindful of event risk around data and Fed headlines.
- Mean‑reversion traders: fade over‑extensions back into the flag if momentum diverges and volume fades, scaling out near mid‑flag or moving averages. A loss of ~25,000 can open a tactical swing toward 24,000–24,600.
With earnings still dense, overnight gap risk is elevated, use defined‑risk structures or tighter stops.
Final Outlook
The pattern leans constructive if price accepts above 25,900-26,200 on rising volume and breadth doesn’t deteriorate. Without that, exhaustion becomes more likely, with 24,000-24,600 a reasonable tactical destination before higher‑timeframe bulls can reassert control. As always: levels first, then signals, then stance, and past performance isn’t a reliable guide to future results.