Bitcoin’s 50% Pullback: What Changed, What Matters, and What’s Next
Bitcoin’s latest drop felt like the market hitting a reset button after running too hot. It had just set a record high near $126,198 on October 6, 2025, and then slid into the $66,000 to $68,000 range by mid to late February 2026, which is roughly a 50 percent pullback in a short window. Many outlets compared the retreat to the sharp moves seen after the FTX collapse, especially once Bitcoin slipped below the key $70,000 level.
The reasons behind the fall were not complicated. They simply arrived at the same time. After the new high, investors took profits, which is normal after a big run. But once the price dipped under major round numbers such as $70,000, nerves kicked in and selling began to speed up. At the same time, spot Bitcoin ETFs, which had been steady buyers for months, suddenly turned into sellers. They posted weeks of outflows totalling around $3.8 to $4.5 billion. That shift hurt confidence and added a steady stream of supply to the market.
The drop felt harsher because liquidity thinned out. On the worst days, order books were so light that even routine selling pushed prices lower than usual. Traders often refer to this as an “air pocket” effect in fast markets. The broader environment added pressure as well. Headlines about tariffs and geopolitical tension were already making investors cautious across all risk assets, not just crypto. As the pressure increased, sentiment swung from concern to fear. The Crypto Fear and Greed Index even fell to a reading of “5,” which is a level that usually appears only near capitulation.
Trend Breaks and the Technical Picture
Viewed simply through the chart, the story is consistent. Bitcoin slipped below long‑term trend markers that many investors pay close attention to. On weekly charts, losing the 50‑week EMA has often lined up with mid‑cycle pullbacks in the 40 to 50 percent range along with a stretch of messy, uneven recoveries. That risk was already on the radar in late 2025. On daily charts, traders were focused on the 200‑day moving average, which was sitting in the $58,000 to $60,000 region during the February stress. Many saw this area as a level the market needed to hold to prevent deeper damage. None of this is unusual. It reflects the way trend‑following money tends to behave once momentum weakens.
There is still one constructive element worth noting. Long‑term holders have repeatedly defended certain “value zones” in past cycles. Several cycle studies and on‑chain metrics pointed to a Realized Price region around $55,000 as an area where patient investors historically begin to step back in. It is not a promise of support, but it is a level that shows up again and again after major selloffs.
Bitcoin Pullback and Trend Breaks: October 2025 to February 2026
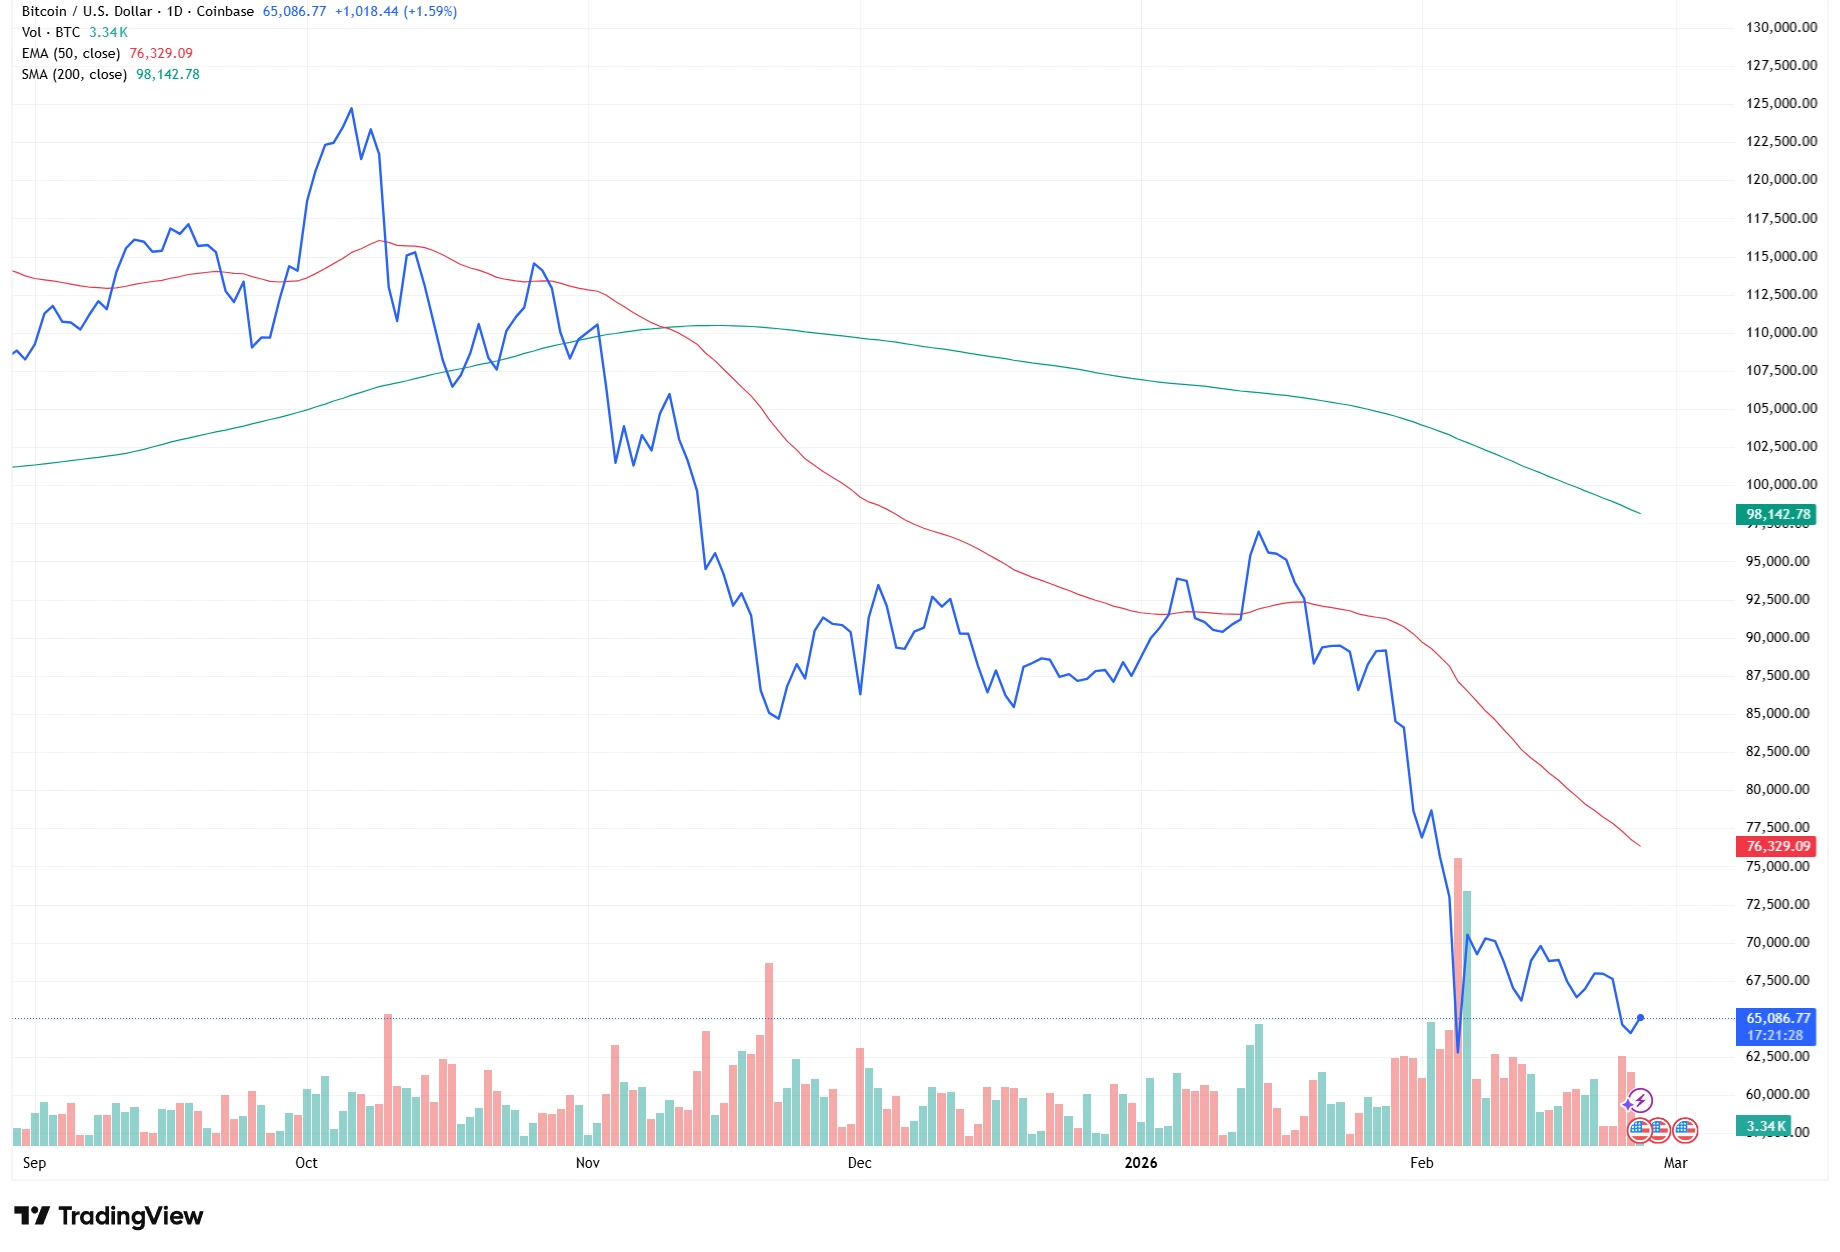
Source: TradingView. Past performance is not a reliable indicator of future performance. Data as of 25 February 2026.
From Here: Three Paths
Where does that leave the market now? Think in terms of three scenarios, ranked by probability rather than drama.
- Flows stabilize and turn positive again.
ETF outflows slow, then reverse; price reclaims broken levels, especially the $70,000 area, and the narrative gradually shifts from panic to patience.
- A cooling phase and base‑building stretch.
The market spends time between $55,000 and $70,000 as macro noise settles and on‑chain accumulation returns, setting up a healthier, slower advance later in the year.
- The lower‑probability tail risk.
If sellers punch through the low‑$60,000s with conviction and ETF outflows persist, some analysts still point to the historical 70% retracement playbook. That would place roughly $40,000 on the table sometime in 2026.
A bit of cycle perspective helps here. Bitcoin has logged more than twenty 40%+ corrections since 2011. Mid‑cycle drawdowns of 35-50% have often reset overheated conditions without ending the broader cycle, and recoveries from those tend to unfold over 9-14 months, far quicker than the multi‑year rebuilds following 70-80% bear‑market collapses. That context doesn’t promise anything, but it clarifies where this move sits in the broader historical pattern.
Conclusion
The bottom line is straightforward. This drop was not the result of some new structural failure inside crypto. It was a hot market coming up against tighter liquidity, shifting ETF flows, and a wave of investor nerves. The key things to watch from here are simple. One is whether ETF outflows slow down and begin to turn positive again. Another is whether the market can stay above the long‑term trend levels that traders pay attention to. A third is whether the $55,000 value region attracts the same patient buying interest it has in past cycles. When these pieces start to line up, both sentiment and price usually follow.