Bitcoin: From January’s Surge to February’s Pullback – What Really Happened
Bitcoin’s journey through early 2026 has been a story of strong momentum, sudden reversal, and a market now trying to find its footing again. After a powerful move into mid‑January that pushed prices close to $98,000, the trend flipped sharply, leaving many investors wondering what triggered the shift and where things stand today.
A Rally Fuelled by Institutional Demand
The early‑January surge wasn’t random. Instead, it was powered by a wave of institutional buying through US spot Bitcoin ETFs.
On January 13, these ETFs absorbed an estimated $754 million in net inflows (their strongest single‑day tally since October). Fidelity’s FBTC alone captured $351 million, outpacing every other fund that day.
These inflows mattered because they signalled that large investors were re‑entering the market after months of caution. Bitcoin briefly reclaimed the $95,000 area on the same day, helped by easing inflation data and renewed optimism about policy direction.
ETF inflows can play a powerful role in Bitcoin’s price because they offer traditional investors a simple, regulated way to gain exposure without holding physical Bitcoin. As inflows grow, fund managers must buy Bitcoin to match demand, effectively adding steady, mechanical buying pressure.
A Rapid Shift in the Macro Environment
But the positive tone didn’t last. At the end of January, the broader economic backdrop took a more cautious turn.
The Fed announced no change to interest rates, keeping them at 3.50%-3.75%, but its communication suggested a more hawkish or restrictive stance going forward. A “higher for longer” signal generally weighs on risk assets such as Bitcoin because it implies tighter financial conditions and a stronger US dollar.
A stronger dollar typically puts pressure on Bitcoin for two reasons:
- It reduces global liquidity, the fuel that risk markets run on.
- It makes traditional yield‑bearing assets more attractive than speculative ones.
At the same time, fresh economic data showed stronger activity across manufacturing, services, and employment. PMI and payrolls figures pointed to resilient business conditions, reducing expectations for near‑term rate cuts. For Bitcoin, which often benefits when markets anticipate easier monetary policy, this was another headwind.
A Clear Break in Market Structure
Technically, Bitcoin was still in a healthy uptrend throughout January, consistently forming “higher highs” and “higher lows”, the hallmark of a rising market. That picture changed quickly after the $98k peak.
As prices pulled back, the market failed to form a new higher high into the last week of January. When selling pressure intensified around January 30, Bitcoin broke below its previous higher low. This shift confirmed that the trend had reversed. The decline accelerated into early February, briefly pushing Bitcoin toward ~$60,000, which now marks a major reference point for the current range.
Bitcoin’s Price and Momentum Indicators During the February Reset
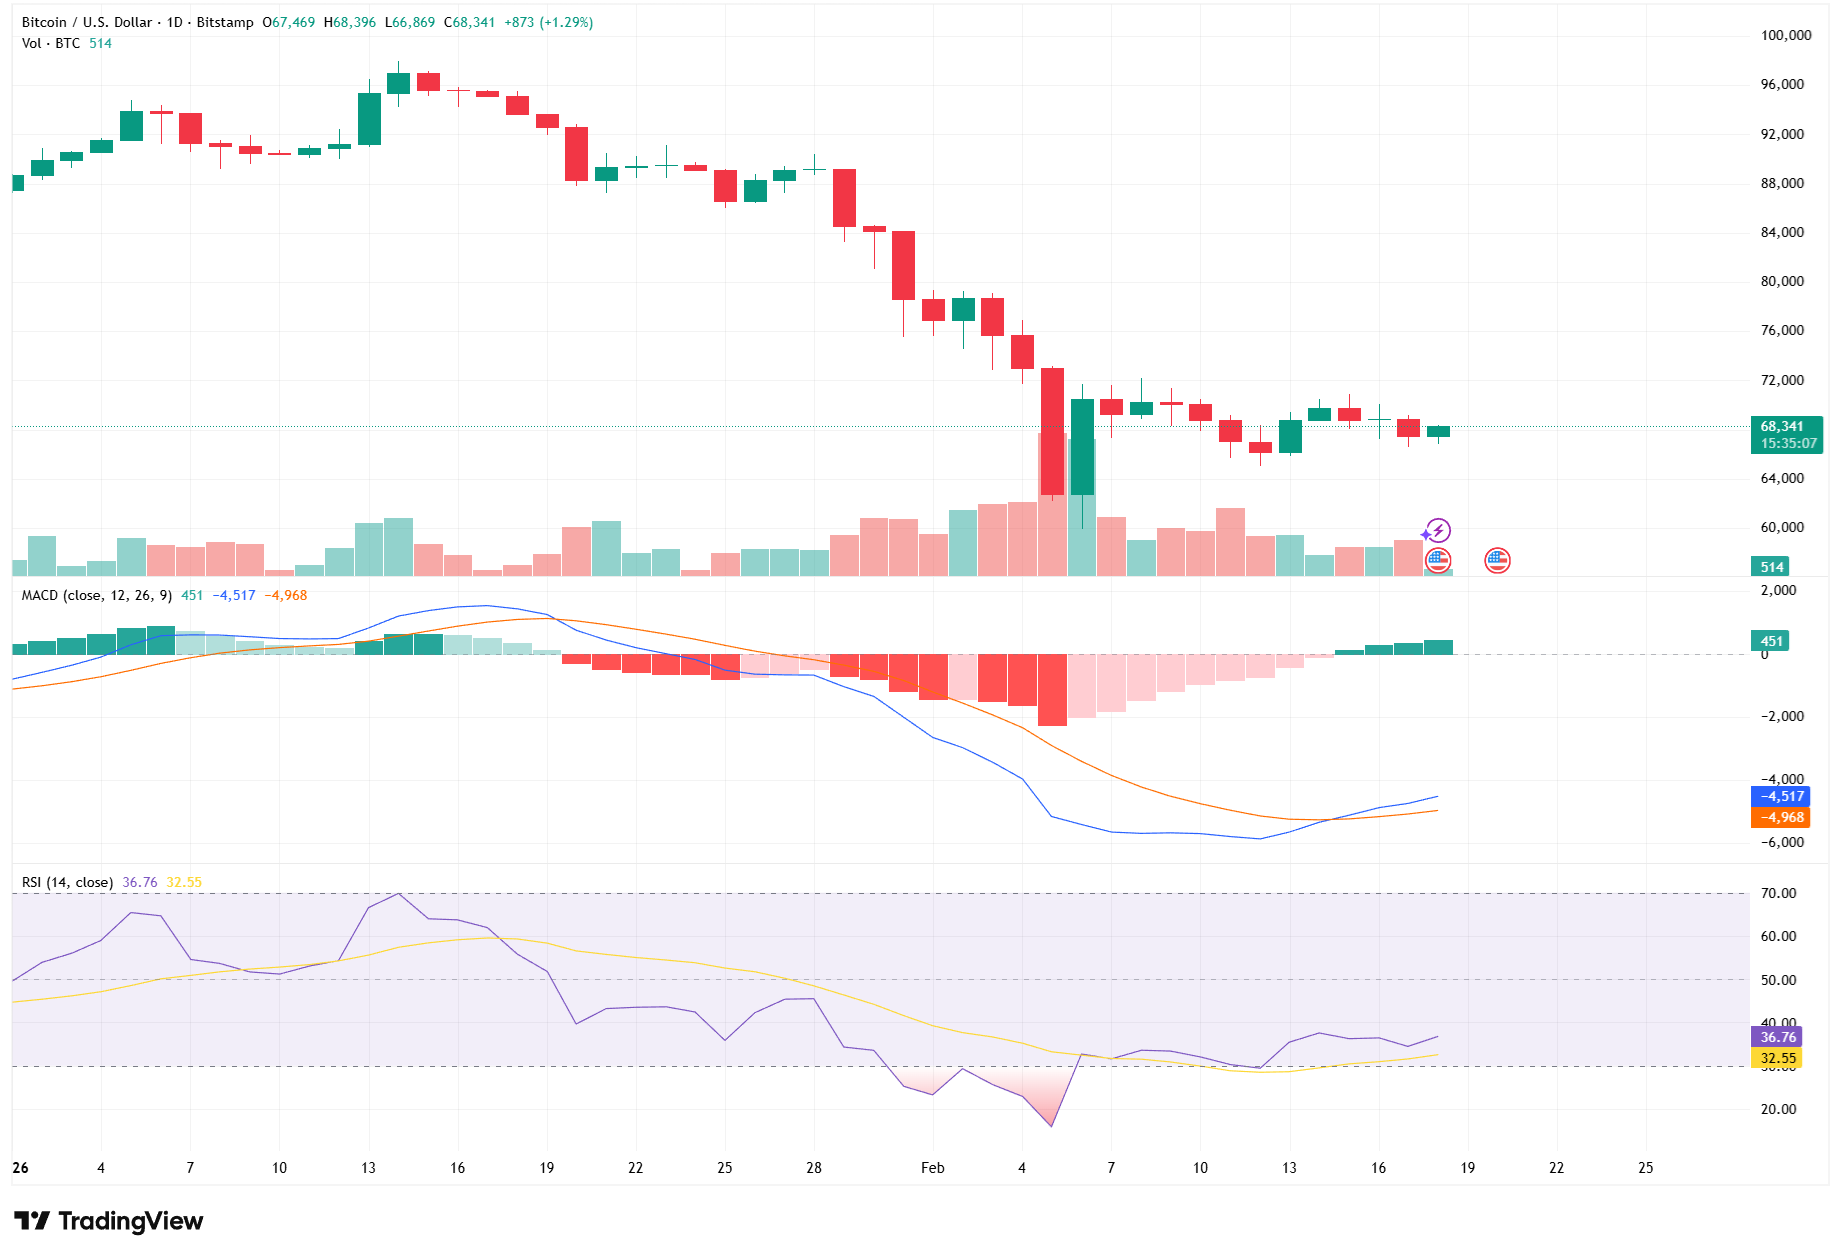
Source: TradingView. Past performance is not a reliable indicator of future performance. Data as of 18 February 2026.
Bitcoin’s early‑February sell‑off followed by a stabilisation phase, with momentum indicators showing weakening but gradually easing downside pressure.
The pullback wasn’t just visible in price. Momentum indicators also softened:
- RSI, a gauge of buying versus selling strength, slid below its midline.
- MACD, which tracks trend direction, moved deeper below zero.
Both pointed to cooling momentum, though the MACD histogram began narrowing, hinting that the worst of the selling pressure might be behind the market.
Where Bitcoin Stands Now
Bitcoin is now trading below the support area that previously defined its uptrend. This zone has turned into a key resistance band. Market behaviour around it will likely shape the next phase:
- A sustained move back above the band would suggest Bitcoin is healing from the February breakdown.
- Persistent rejection would keep the focus on the lower range, with ~$60k as the level defining downside risk.
For now, the market sits between those two levels, digesting January’s exuberance and February’s reality check.
Bitcoin’s Price Structure
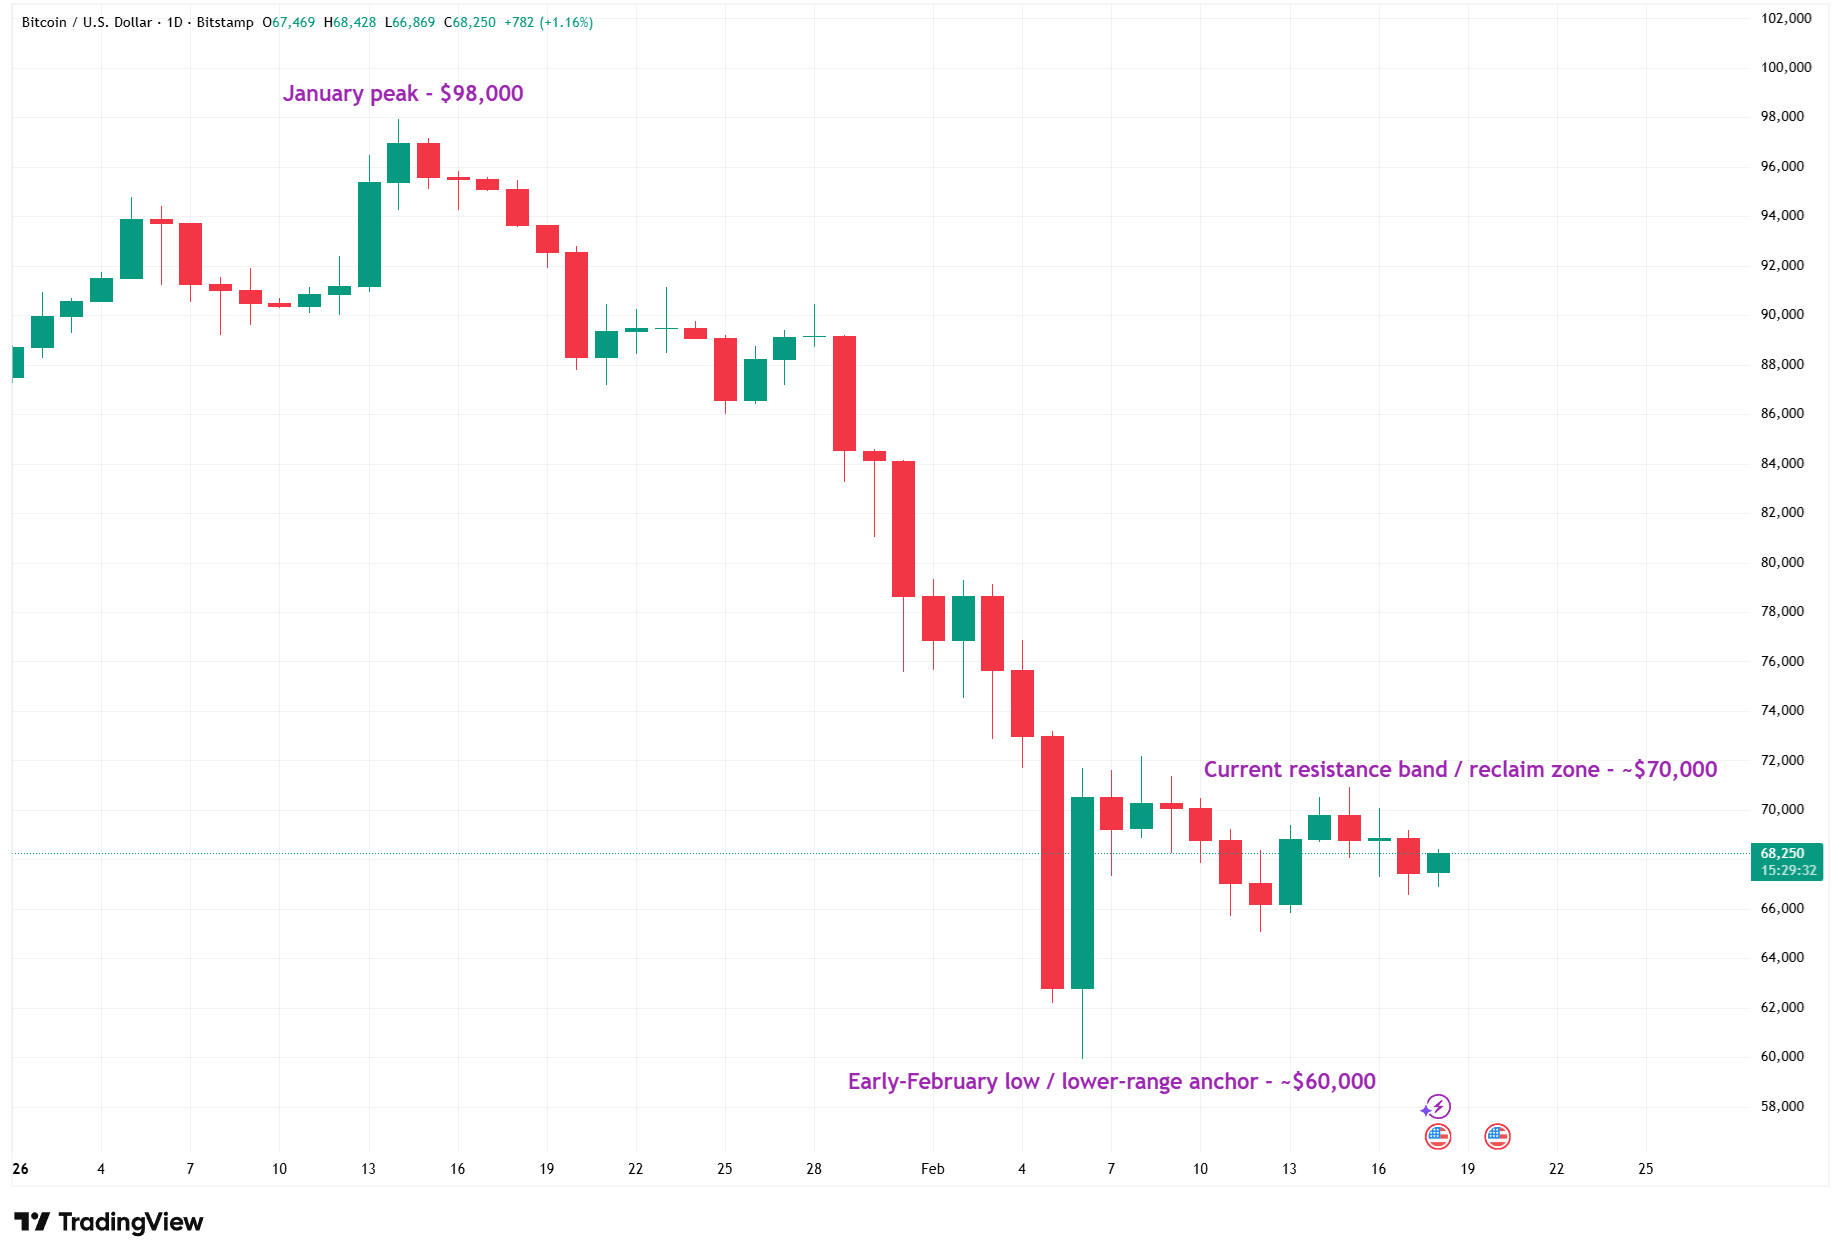
Source: TradingView. Past performance is not a reliable indicator of future performance. Data as of 18 February 2026.
The Bigger Picture
The early‑year surge showed that appetite for Bitcoin remains strong when conditions align, especially through institutional channels such as ETFs. But the reversal illustrates how quickly sentiment can shift when macro forces tighten.
Bitcoin’s story in 2026 so far is ultimately a tale of two halves: a powerful flow‑driven rally, followed by a macro‑driven reset. What happens next will depend less on hype and more on how global markets interpret economic data, interest rates, and liquidity in the weeks ahead.