Apple’s Long-Term Trend: Is the 200-Day Still Holding?
Apple’s stock has managed a decent comeback lately, bouncing back from multi-month lows that had some traders worrying the long-term trend was broken. The rebound has pulled it back above the 200-day moving average, that line on the chart many use as a quick health check for the bigger picture. The big question now? Whether this is the start of a more sustainable recovery or just a breather before sellers take another swing.
What the Charts Say
Early August saw buyers step in hard near the $200 level, defending that area more than once. Since then, price has climbed past the 50-day (around $214) and even the 200-day (roughly $207) moving averages. Both are widely watched, and reclaiming them tilts sentiment toward the bulls. But there’s a catch: price is now leaning into resistance around $233-$234, the same zone that put a lid on gains earlier this year.
Apple Price with 50-Day, 100-Day, and 200-Day Moving Averages
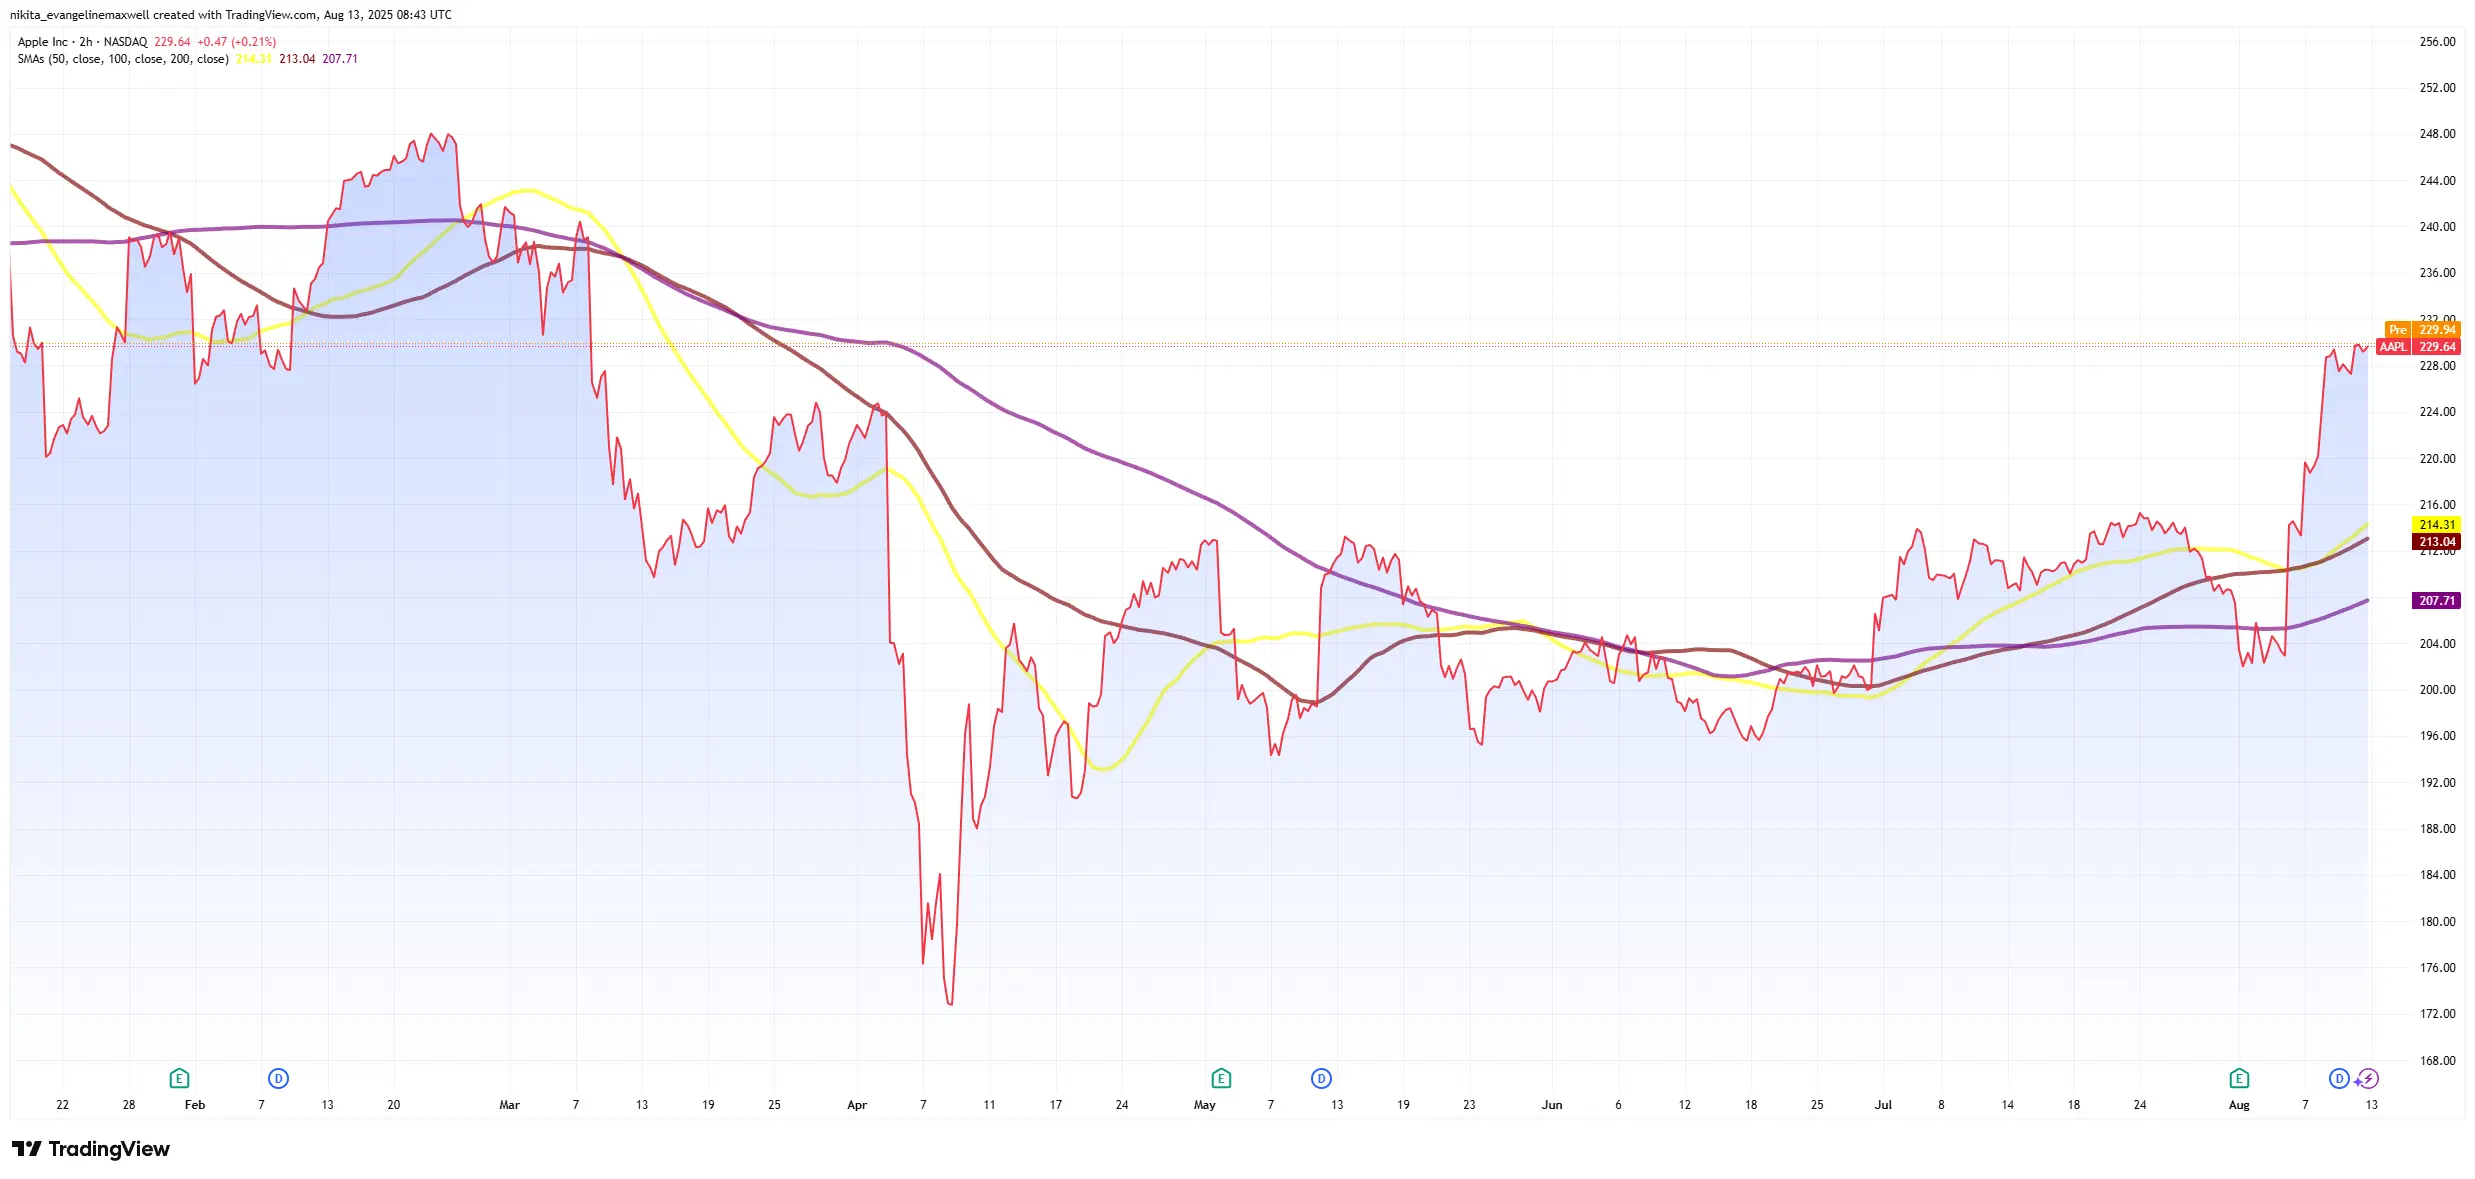
Source: TradingView. All indices are total return in US dollars. Past performance is not a reliable indicator of future performance. Data as of 13 August 2025.
Apple price chart with 50-day, 100-day, and 200-day moving averages showing the recent rebound above long-term trend lines.
Momentum has improved, though there are a few yellow flags. The 14-day RSI, which had sunk into the mid-30s during the sell-off, has rebounded to around 71.6, which is currently in an overbought territory. MACD flipped positive, with a bullish crossover and green histogram bars showing upside momentum is still alive.
Apple RSI and MACD Indicators
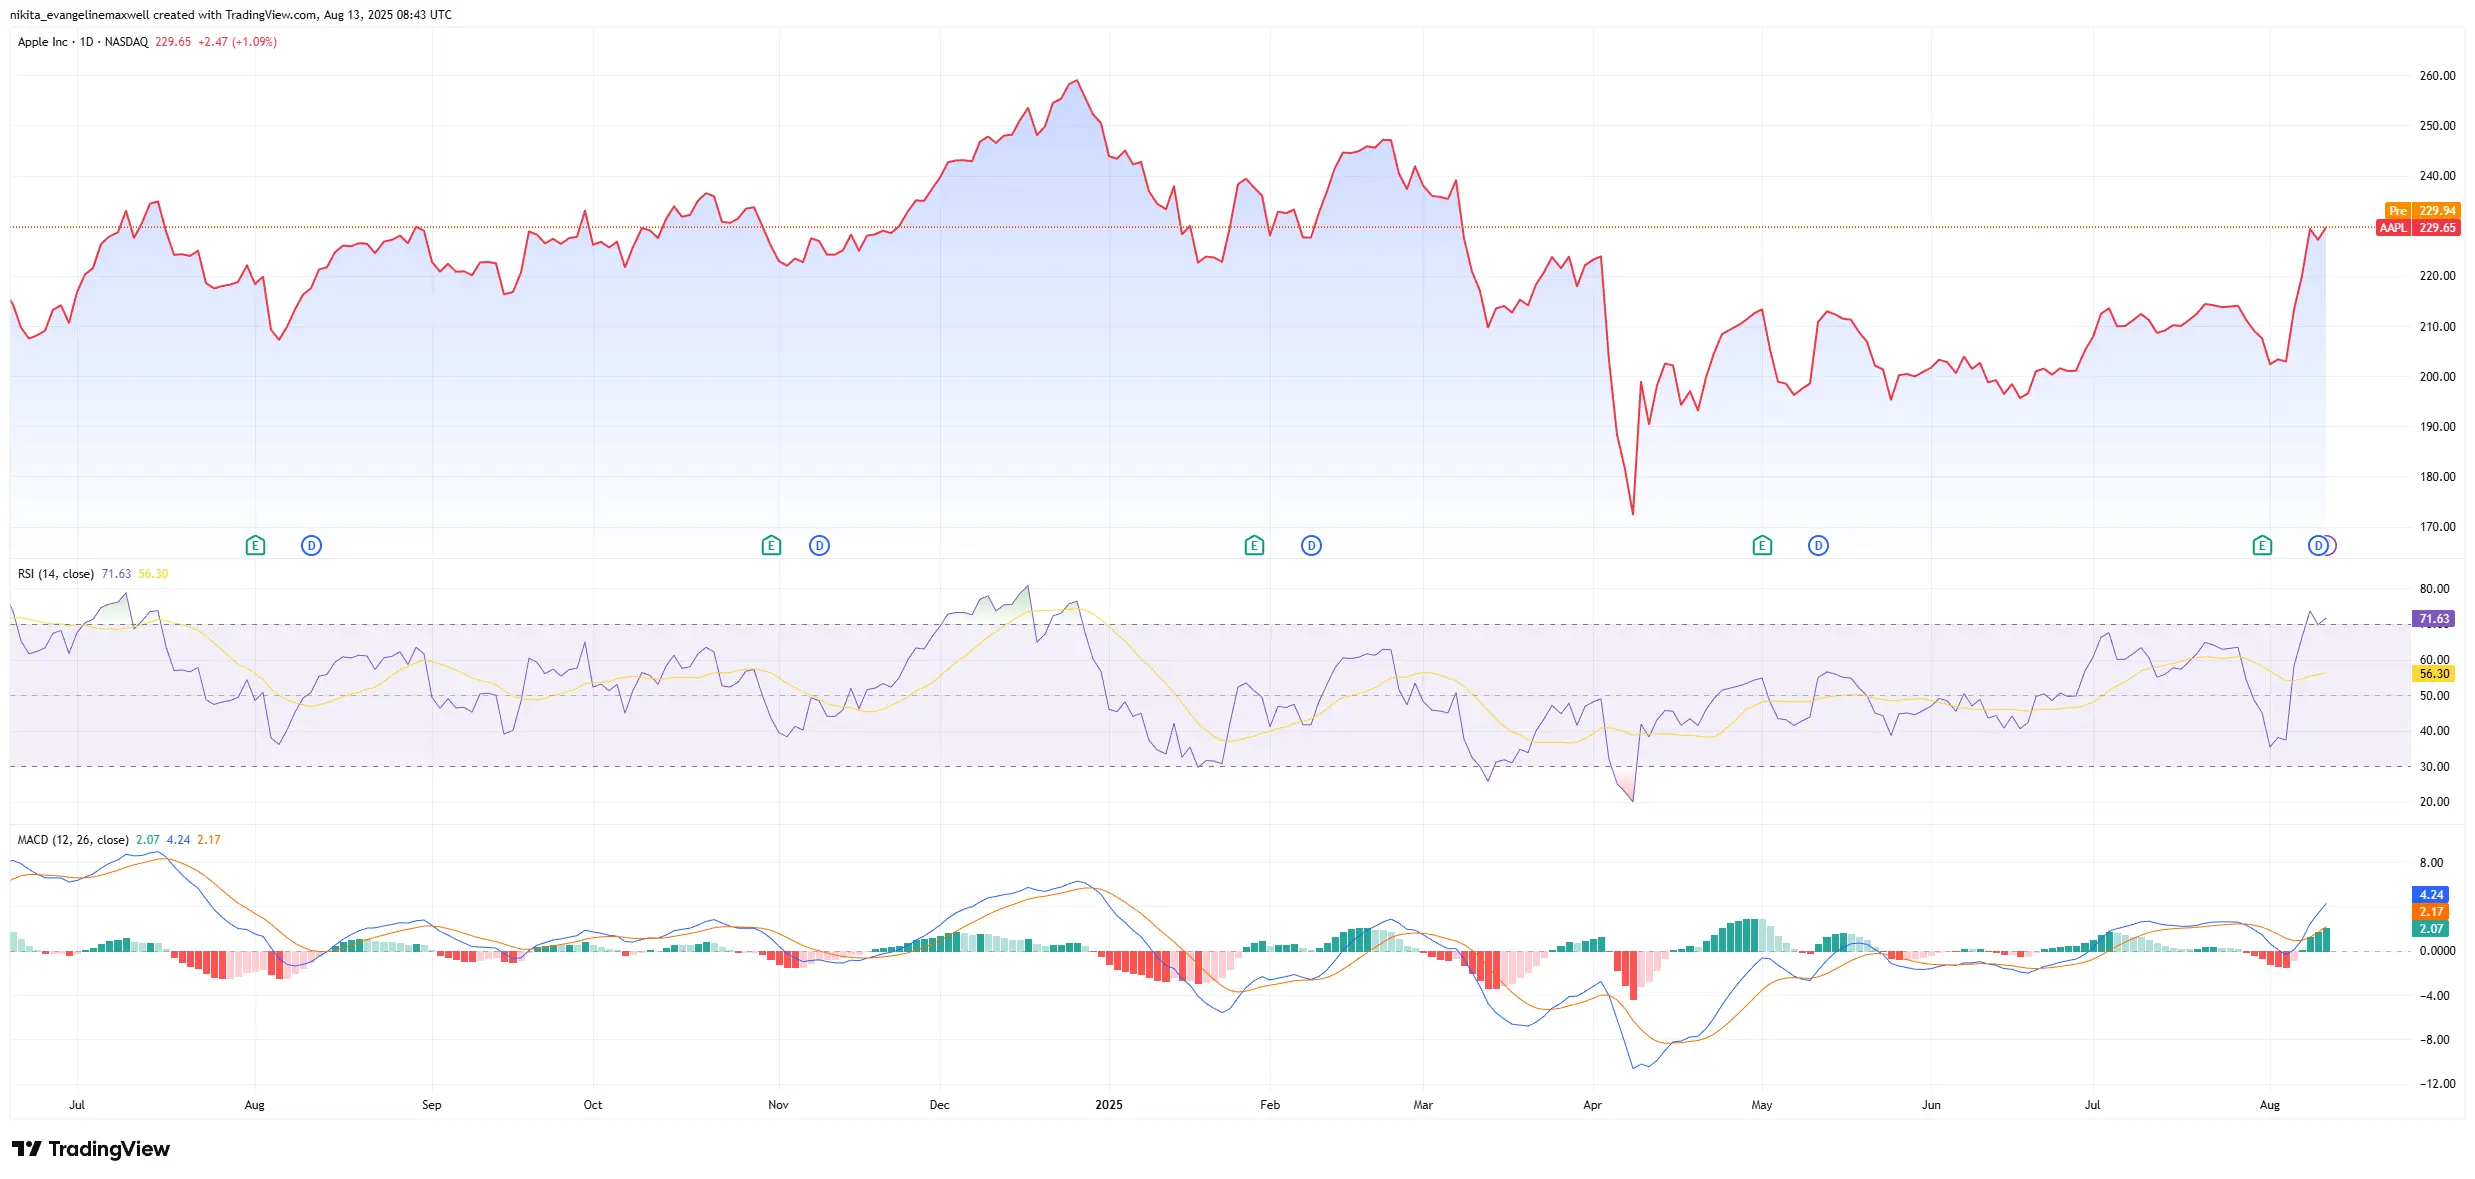
Source: TradingView. All indices are total return in US dollars. Past performance is not a reliable indicator of future performance. Data as of 13 August 2025.
Apple’s RSI approaching overbought territory and MACD showing a bullish crossover.
The concern? Volume was higher in early August during the bounce, then dropped off during the recent move toward $229.
Apple Daily Volume Trends
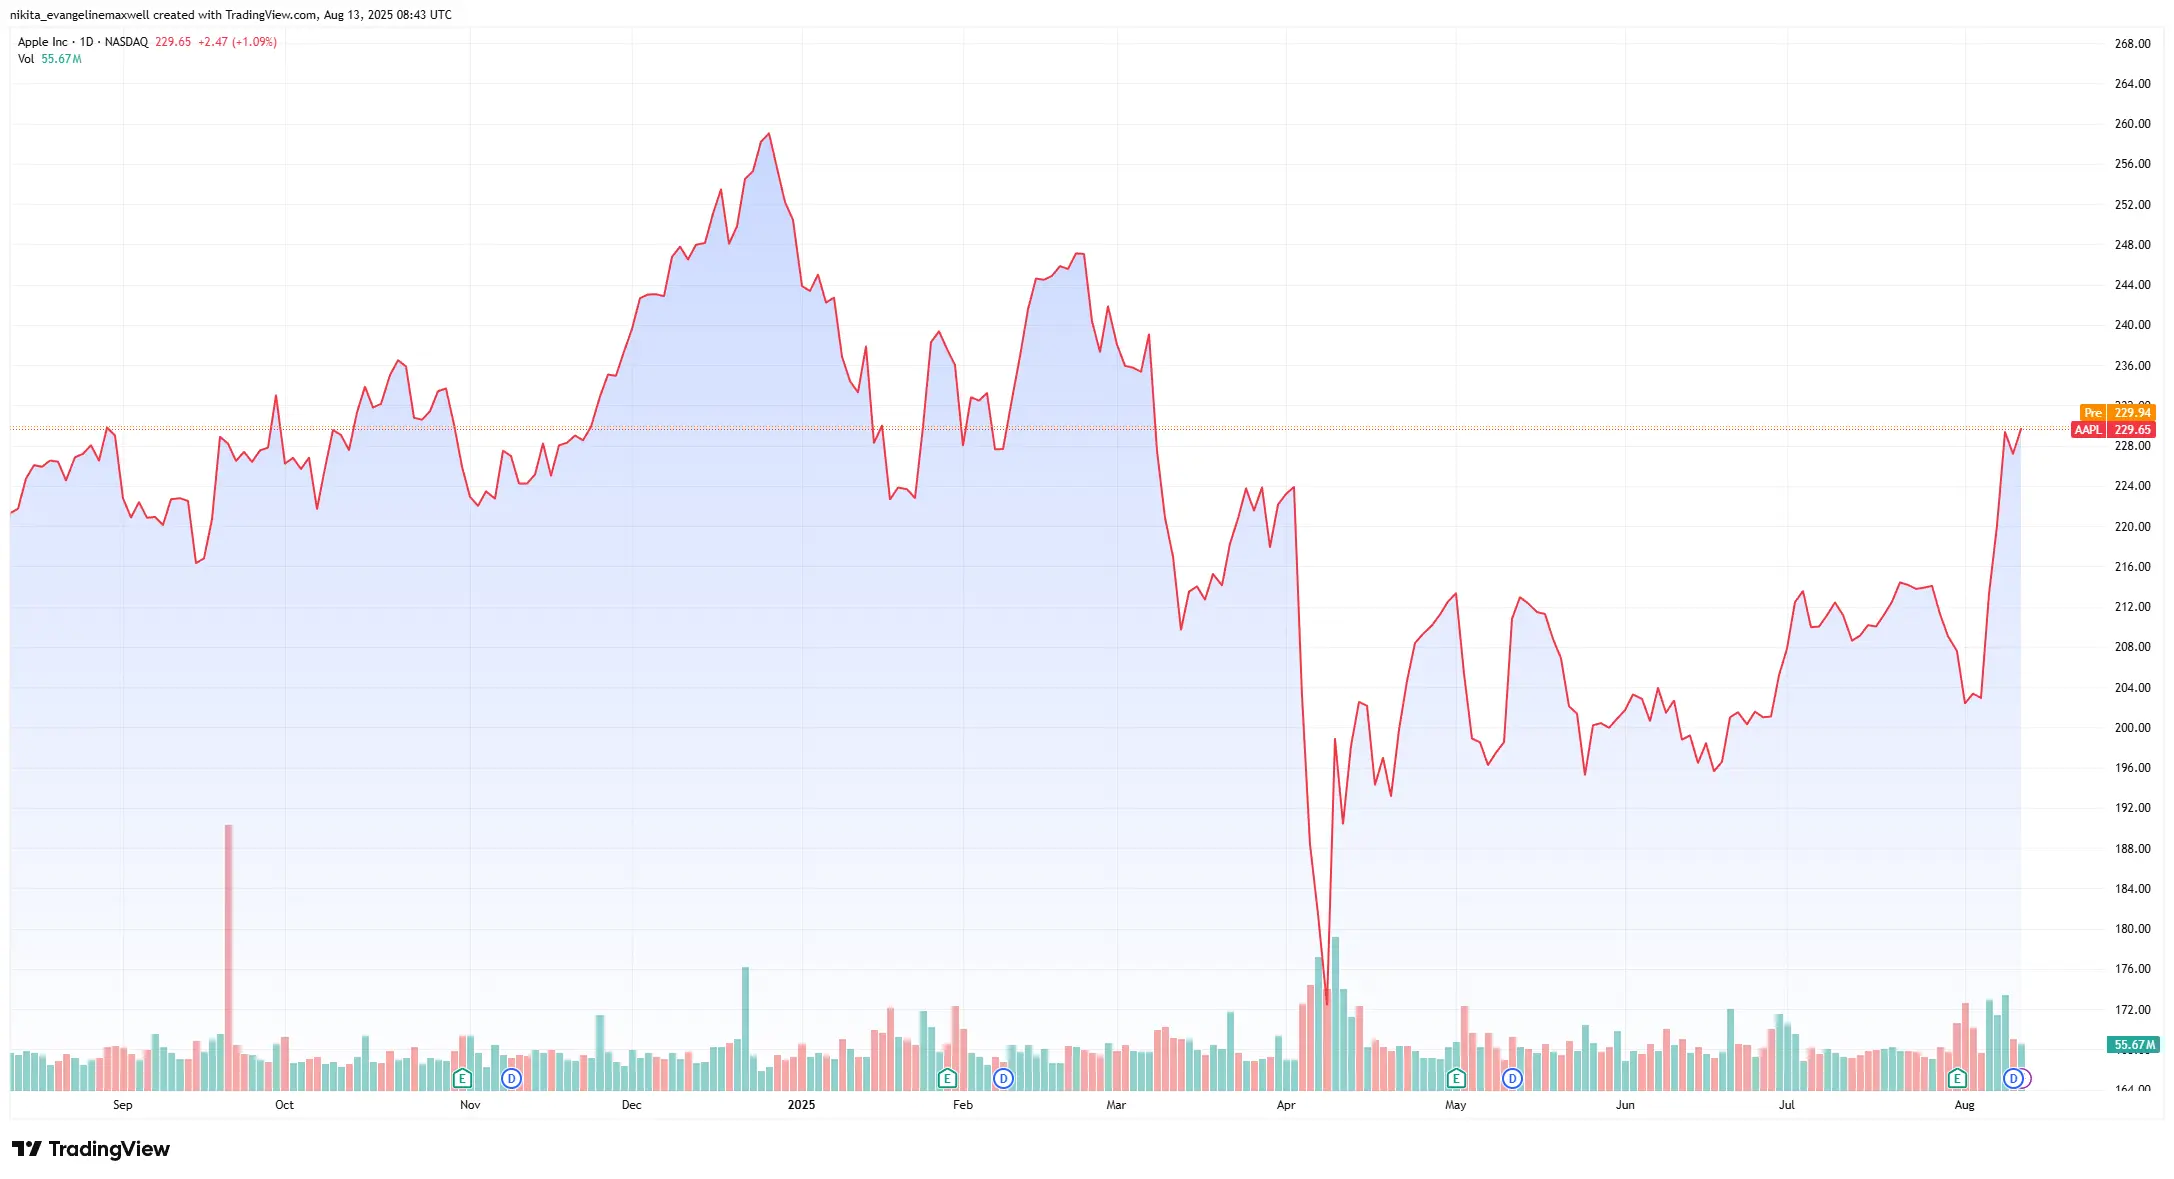
Source: TradingView. All indices are total return in US dollars. Past performance is not a reliable indicator of future performance. Data as of 13 August 2025.
Apple’s trading volume showing lighter participation during the recent push toward resistance.
Momentum or Exhaustion?
The bullish team will tell you this: getting back above the 200-day moving average is no small win. Every time Apple comes close to that line lately, buyers have stepped in, which says they still believe the longer trend is alive. The RSI has just nudged past 70, often a sign things are getting a bit hot, but it also confirms momentum’s still strong. With the price sitting comfortably above both the 50-day and 200-day averages, it wouldn’t take much (maybe a fresh piece of good news?) to push it higher again.
The bears see it differently. They point out that a 13% sprint in such a short time can leave a stock winded. The RSI’s already in overbought territory, a place where past rallies have often run out of steam. The lighter volume on this latest leg up compared to the bounce from $200 suggests fewer traders are jumping in. And if you zoom out, the chart still shows that recent “death cross”, when the 50-day slipped under the 200-day, with the longer average still edging down.
What Traders Are Watching
- 200-Day MA (~$207) – Staying above here on a pullback would help the bullish narrative; slipping under it could shift focus back to downside risk.
- $200 Support – Break this and the floor drops out for short-term sentiment.
- $233–$234 Resistance – A clear, high-volume break here would be a major win for bulls. Failure to clear it may spark profit-taking.
- Momentum Clues – RSI punching above 70 then reversing, or MACD crossing bearishly, could flag tiredness in the rally.
- Volume Patterns – Strength on up-days, weakness on down-days keeps bulls in control; the opposite is a warning sign.
Takeaway
Apple’s bounce has put it back on the right side of the 200-day moving average, but the real test sits just ahead. A clean break through resistance with volume to match could open the door to more returns and momentum. If momentum fades and key support gives way, the story changes quickly. Either way, the next few sessions should reveal whether this is a turning point or just another stop-over in a volatile market.