Why Gold Keeps Climbing Even Without a Crisis
Gold’s been moving higher in recent weeks; not with fireworks, but with steady intent. It’s not like some shock headline lit the fuse. Instead, the backdrop has quietly shifted in gold’s favour. That old inverse link between gold and real yields isn’t behaving the way it used to. What we’ve got now is a mix: fading expectations of more Fed hikes, talk of cuts creeping in, real yields easing, central banks still buying, and the usual simmer of geopolitical tension in the background. Gold’s rally is being driven by positioning for lower rates, ongoing global uncertainty, and the need for portfolio protection. It’s not one big driver, it’s the whole environment leaning its way.
The chart reflects that shift. Gold cleared a long-term ceiling in late 2023 and hasn’t looked back. There’s been no dramatic reversal – just shallow dips, well-supported moves, and a clean, steady structure. When pullbacks come, buyers show up. Even that retrace to the 200-day moving average found support fast. It doesn’t feel like a market being chased – it feels like one being accumulated. The rhythm is calm, directional, and patient. Oscillators like RSI and MACD aren’t screaming, but they’re holding up. And even without explosive moves, the trend is clear. This is a quiet uptrend – and that’s often the kind that lasts.
Gold’s Steady Climb Since Mid‑2025
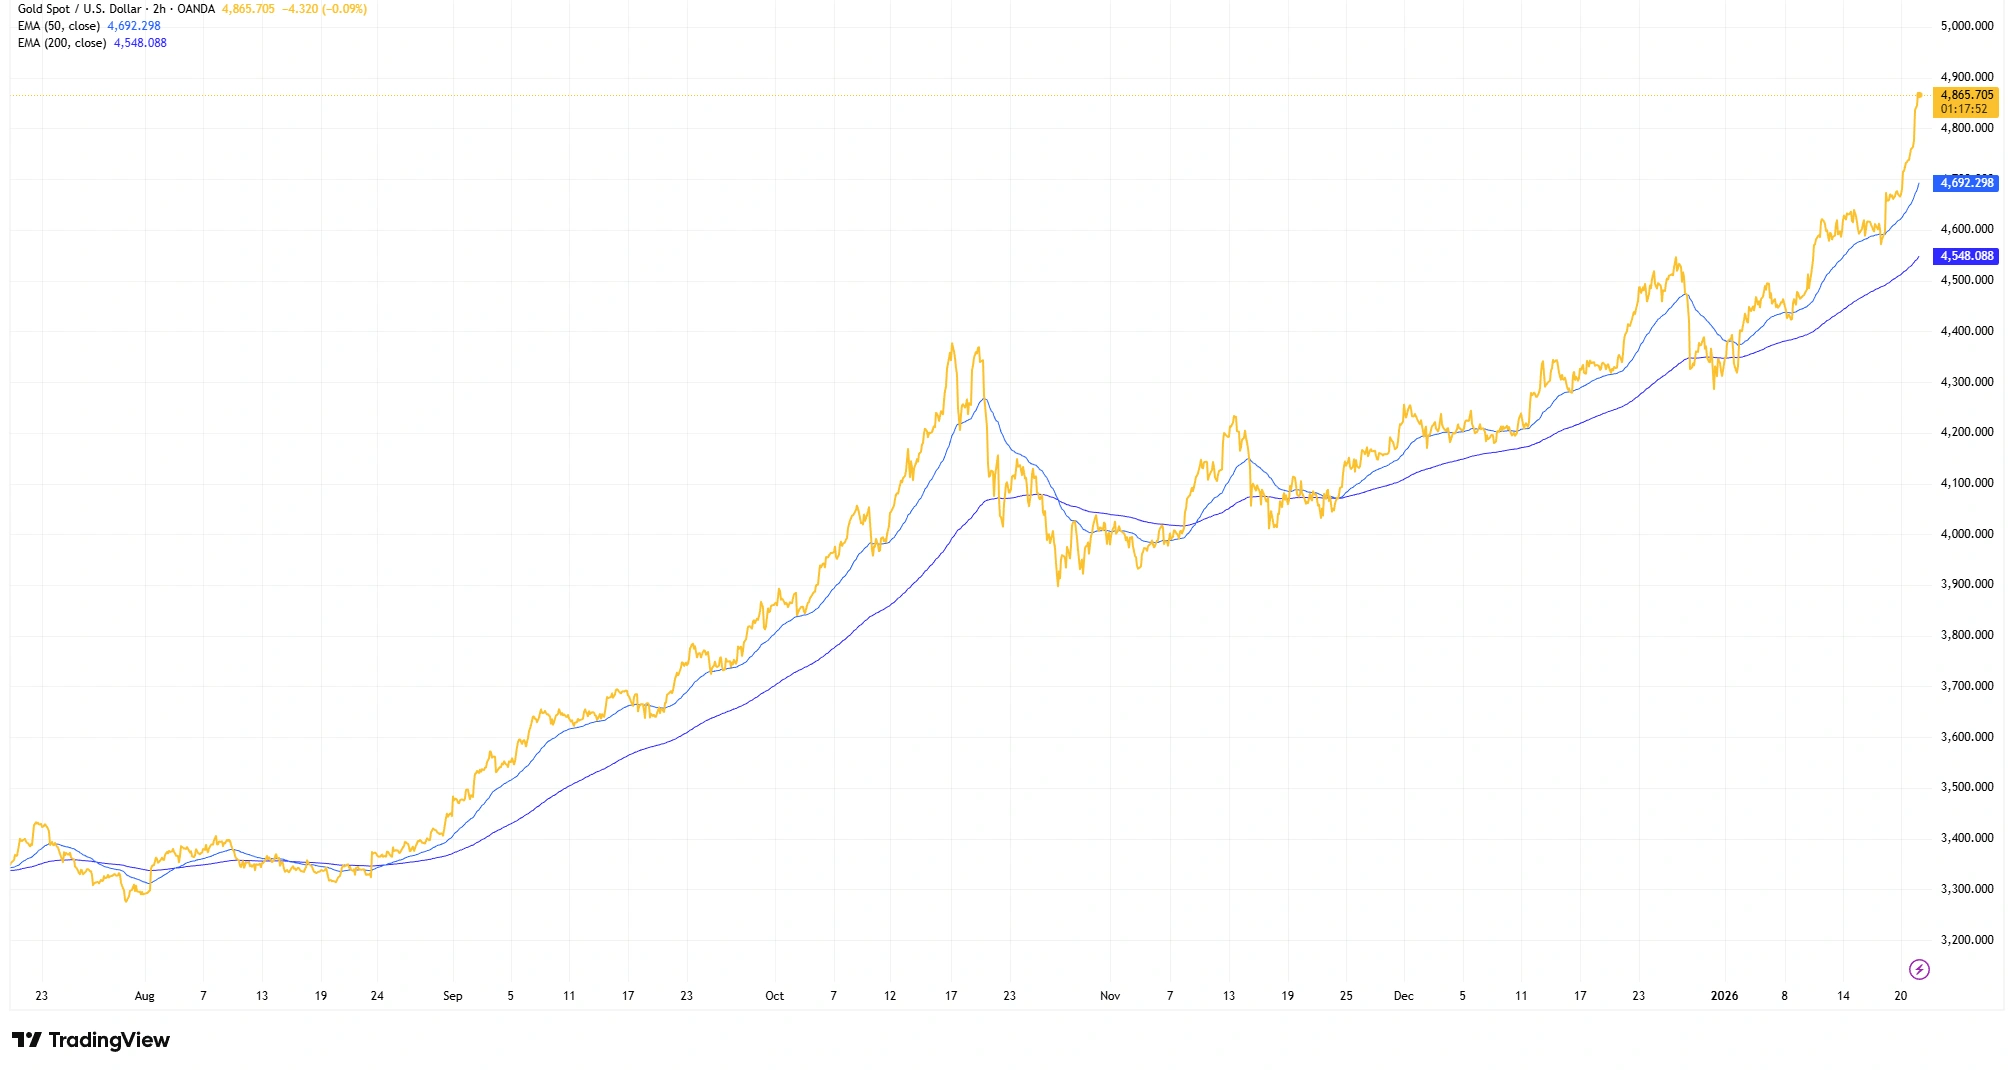
Source: TradingView. All indices are total return in US dollars. Past performance is not a reliable indicator of future performance. Data as of 21 January 2026.
Note: Price scale reflects OANDA’s 2× pricing format for XAUUSD; equivalent to ~$2,430/oz at the latest print.
Gold’s steady climb since August 2025: price trending above 50‑ and 200‑EMAs with shallow, well‑supported pullbacks.
Gold’s rise is playing out against a shifting rate backdrop. Markets have more or less accepted that the Fed is done hiking and are now pricing a turn toward easier policy and softer real yields. Futures are leaning toward the first move as early as spring. That’s directly supportive for gold because lower policy rates mean softer real yields, which lowers the penalty for holding a non‑yielding asset. Lower policy rates compress real yields and reduce the opportunity cost of holding gold. You can see that reflected in the chart – not with fireworks, but with a steady, grinding rally. Price drifts higher, pullbacks are mild, and buyers keep stepping in. It’s classic gold‑in‑a‑dovish‑shift behaviour: less spiky, more persistent.
Gold Rises as Real Yields Ease
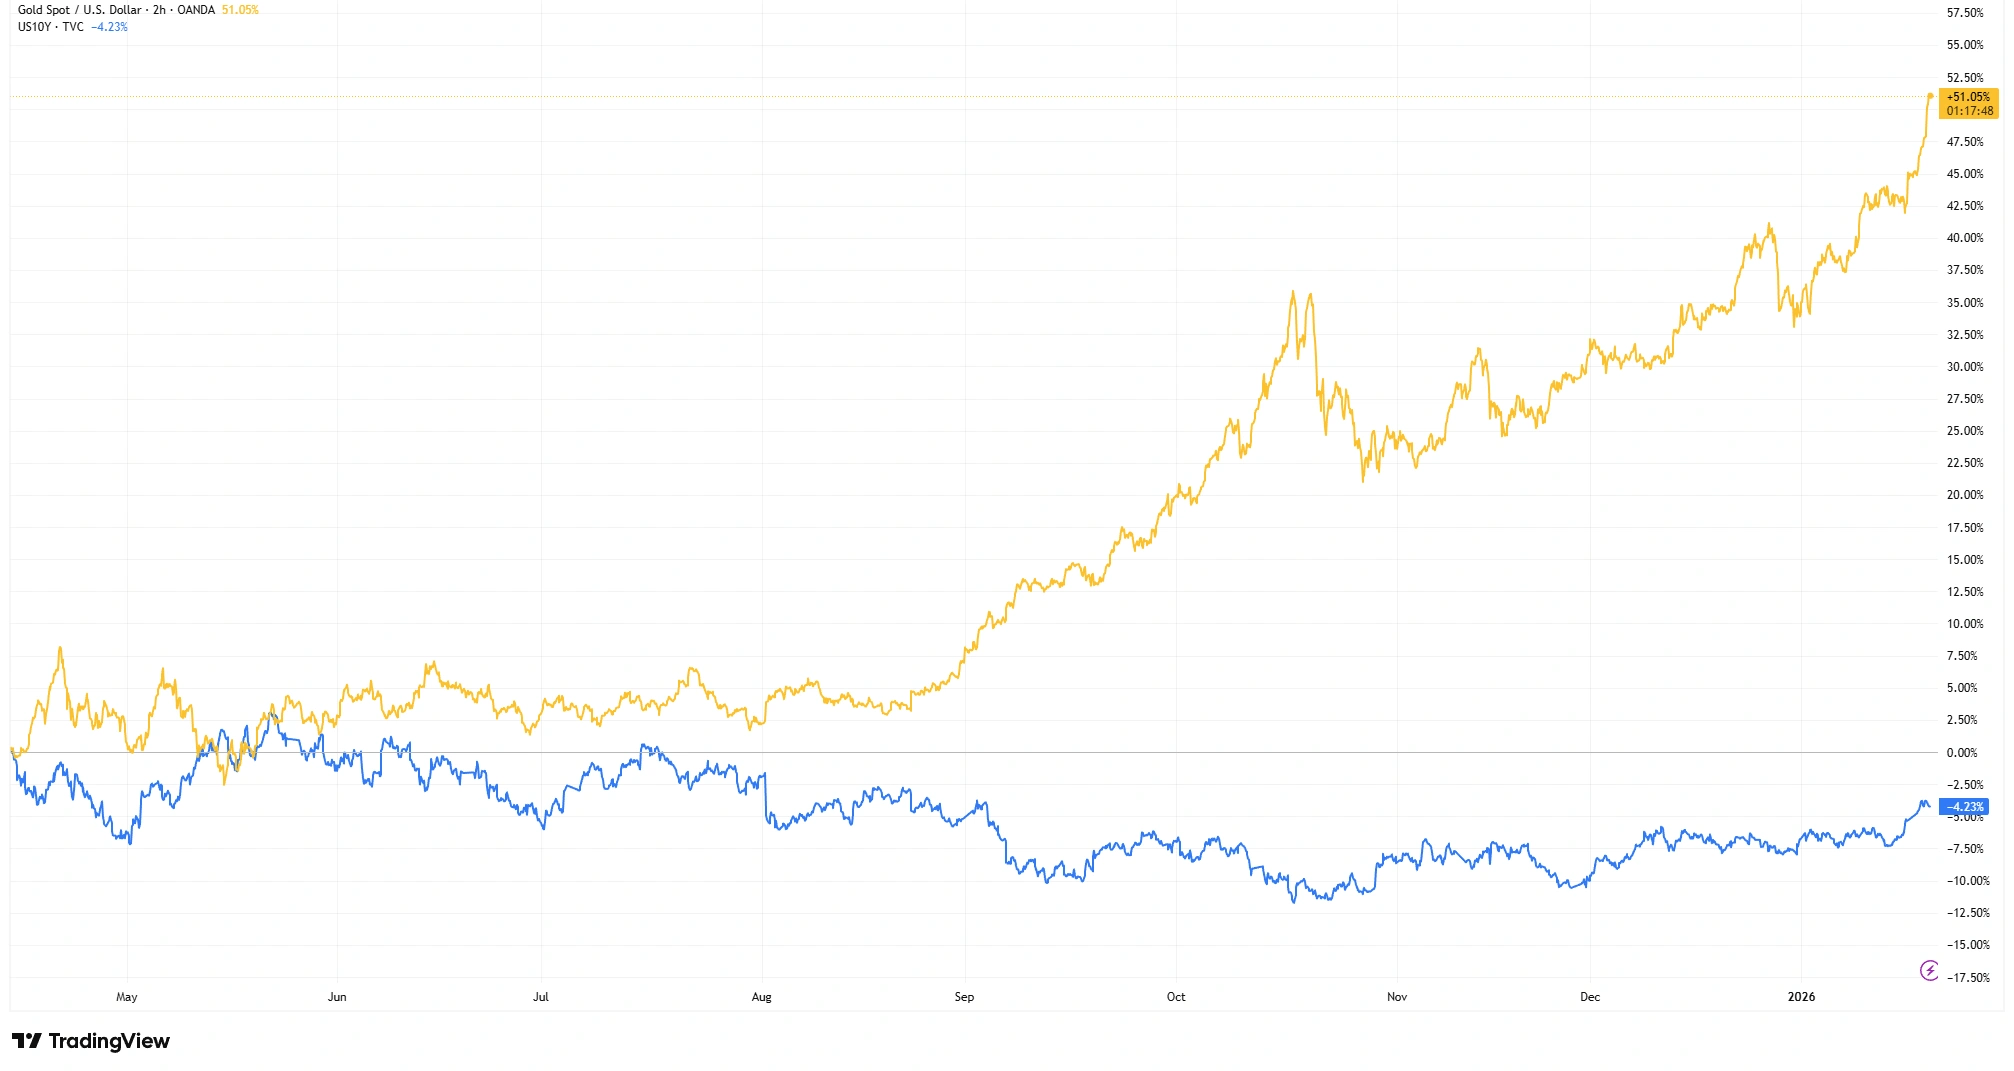
Source: TradingView. All indices are total return in US dollars. Past performance is not a reliable indicator of future performance. Data as of 21 January 2026.
Note: Price scale reflects OANDA’s 2× pricing format for XAUUSD; equivalent to ~$2,430/oz at the latest print.
Gold has risen as US 10‑year yields eased – the classic inverse relationship. Consider inverting the yield axis or using 10‑year real yields to show this more clearly.
As for momentum, the indicators show a healthy, unspectacular advance on the broader trend, while intraday signals have run hot. On intraday timeframes, RSI has reached overbought levels (e.g., ~87 on the 1‑hour chart), but the broader structure remains orderly and supported. MACD is positive and constructive rather than blown out, and pullbacks have been shallow. In plain terms, momentum is doing its job without turning parabolic: the slope is steady, participation is broad, and the market isn’t exhausted – just trending higher in measured steps.
Momentum Builds, But Isn’t Overheating
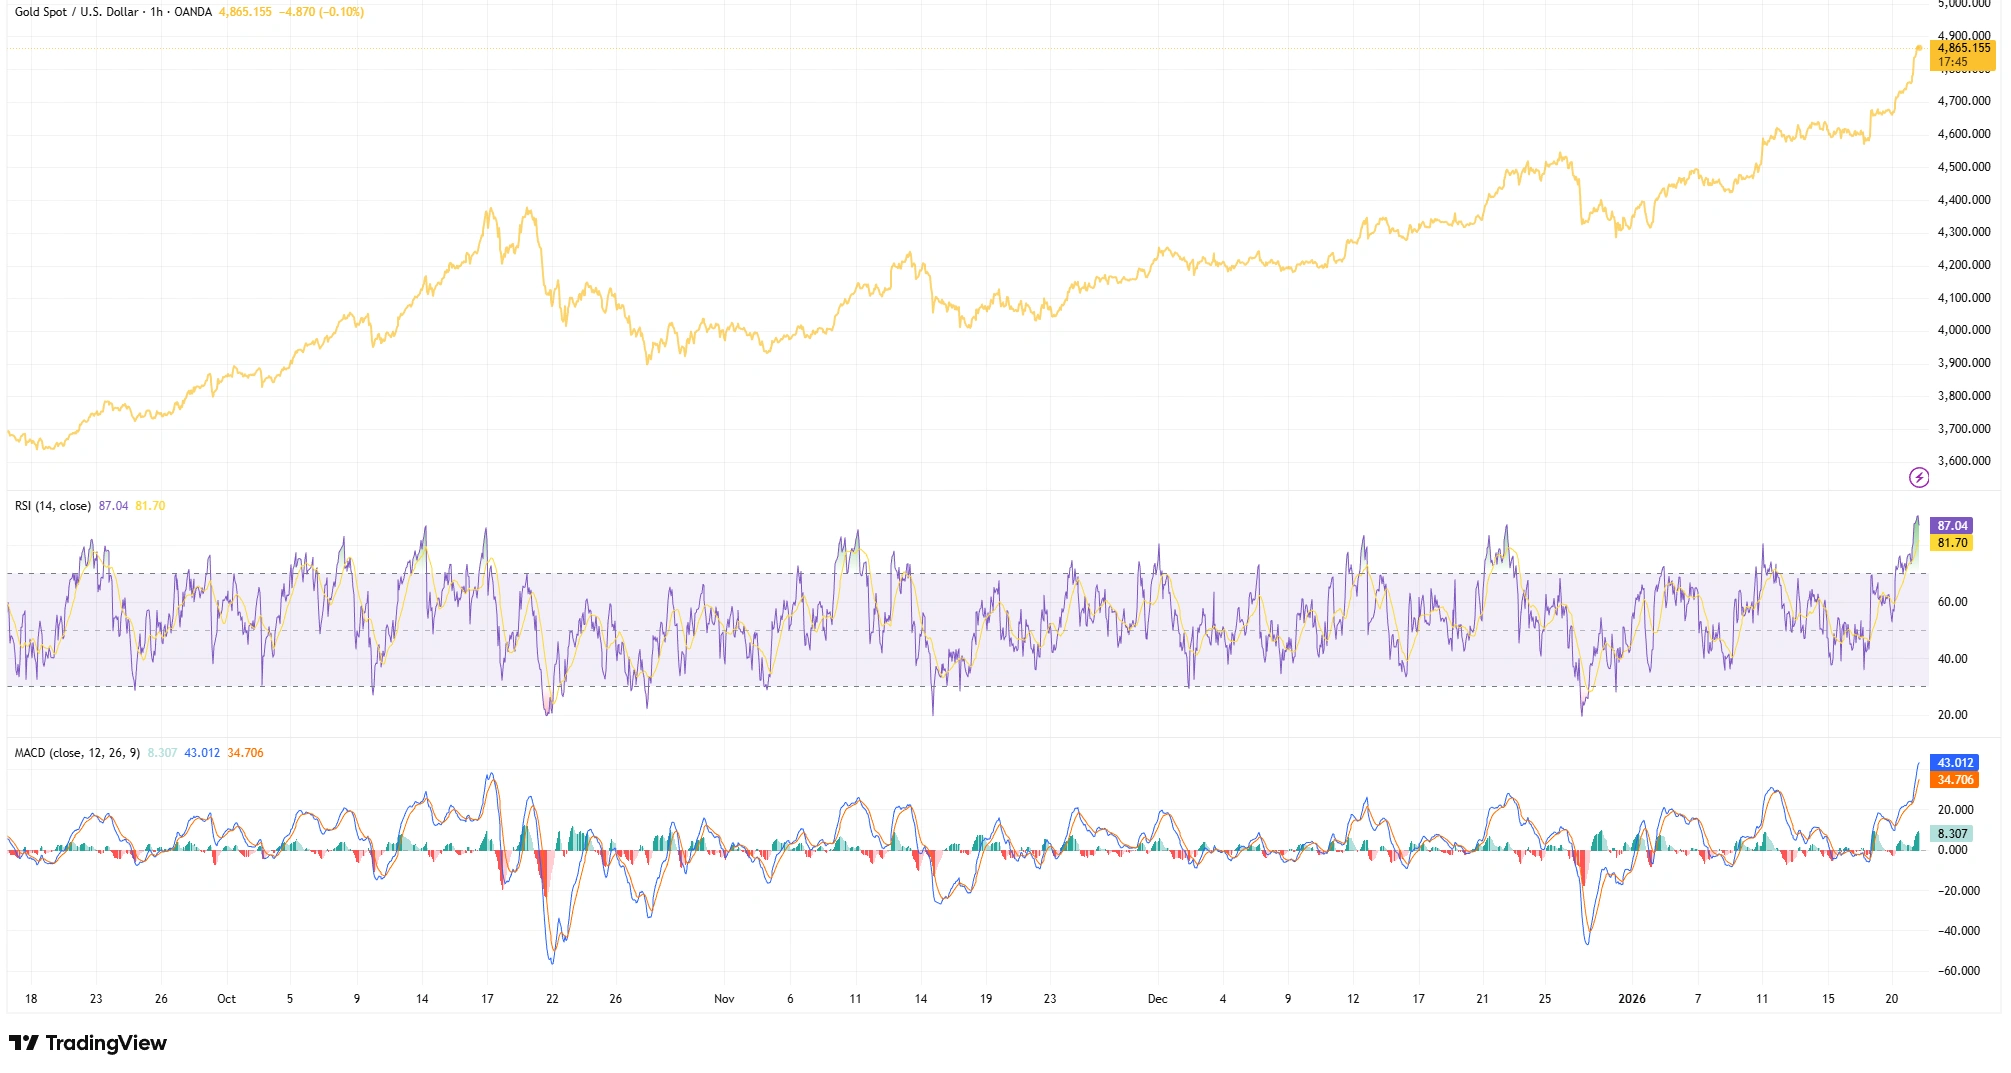
Source: TradingView. All indices are total return in US dollars. Past performance is not a reliable indicator of future performance. Data as of 21 January 2026.
Note: Price scale reflects OANDA’s 2× pricing format for XAUUSD; equivalent to ~$2,430/oz at the latest print.
Momentum has strengthened: intraday (1‑hour) RSI reached overbought levels, while broader trend structure remains orderly.
Market sentiment and positioning remain unusually balanced. Central banks, especially in emerging economies, continue to buy gold in size, at historically elevated levels. This official demand remains a supportive backdrop, though precise annual totals should be verified for the latest year. Meanwhile, private and retail enthusiasm isn’t euphoric. Commitments-of-traders data and sentiment surveys show only a modest bullish tilt. There’s no herd behaviour fuelling this move. The chart reflects that. The climb has been gradual and orderly, not frenzied. Trends that begin with this kind of grounded support, broad buying without manic excess, often last.
Takeaway: Gold may not be screaming into a new bull market, but it’s speaking in a steady voice. With yields softening, the Fed done hiking, and geopolitical risk lingering, gold’s patient climb is telling. Sometimes it’s the quiet consistency, not the fireworks, that signals a trend with staying power.