Volume Analysis: The Missing Piece in Support & Resistance Trading
Traders often mark neat horizontal lines on charts for support and resistance, but sometimes those levels seem to hold firm and other times they break with no warning. Why the difference? The answer usually lies in volume. A support line backed by high trading volume is a lot more likely to hold than one drawn in thin air. As Investopedia notes, “the more buying and selling that has occurred at a particular price level, the stronger the support or resistance level is likely to be”. In short, volume analysis is the missing piece that confirms whether your support or resistance line is meaningful.
How It Works
Volume bars on charts turn into clues. Price levels where volume spikes often act like magnetised zones: buyers or sellers flooded in there before, so price tends to pause or reverse at those levels.
Consider support: if price approaches a known support level and a big jump in volume occurs (buyers stepping in), that level will likely hold – it’s now reinforced by actual demand. By contrast, if price slips to support on low volume, there’s no real buying interest and the level may fail. The same idea applies to resistance: heavy volume at a resistance level means strong selling (making it hard to break through), whereas a quiet volume suggests a breakout could happen easily.
Volume is also crucial at breakouts. If a stock or commodity quietly sneaks above resistance on tiny volume, it often retreats. A real breakout tends to coincide with a volume spike, indicating many participants joined the move.
Another thing to watch is volume trends. For example, if a commodity’s price keeps hitting new highs but each high comes on falling volume, that divergence can foreshadow a reversal. The market is basically saying “not enough new players are supporting this rally.”
Practical Examples
Imagine an oil chart: price drops to a long-term support at $65/barrel. On one test, volume surges sharply – a crowd of buyers steps in, and oil bounces back. That confirms $65 as a strong support (lots of contracts traded there). On another day, oil dips again to $65, but volume is unusually light; sellers overwhelm the few buyers, and the level breaks to $60. No surprise – without volume, support gave way.
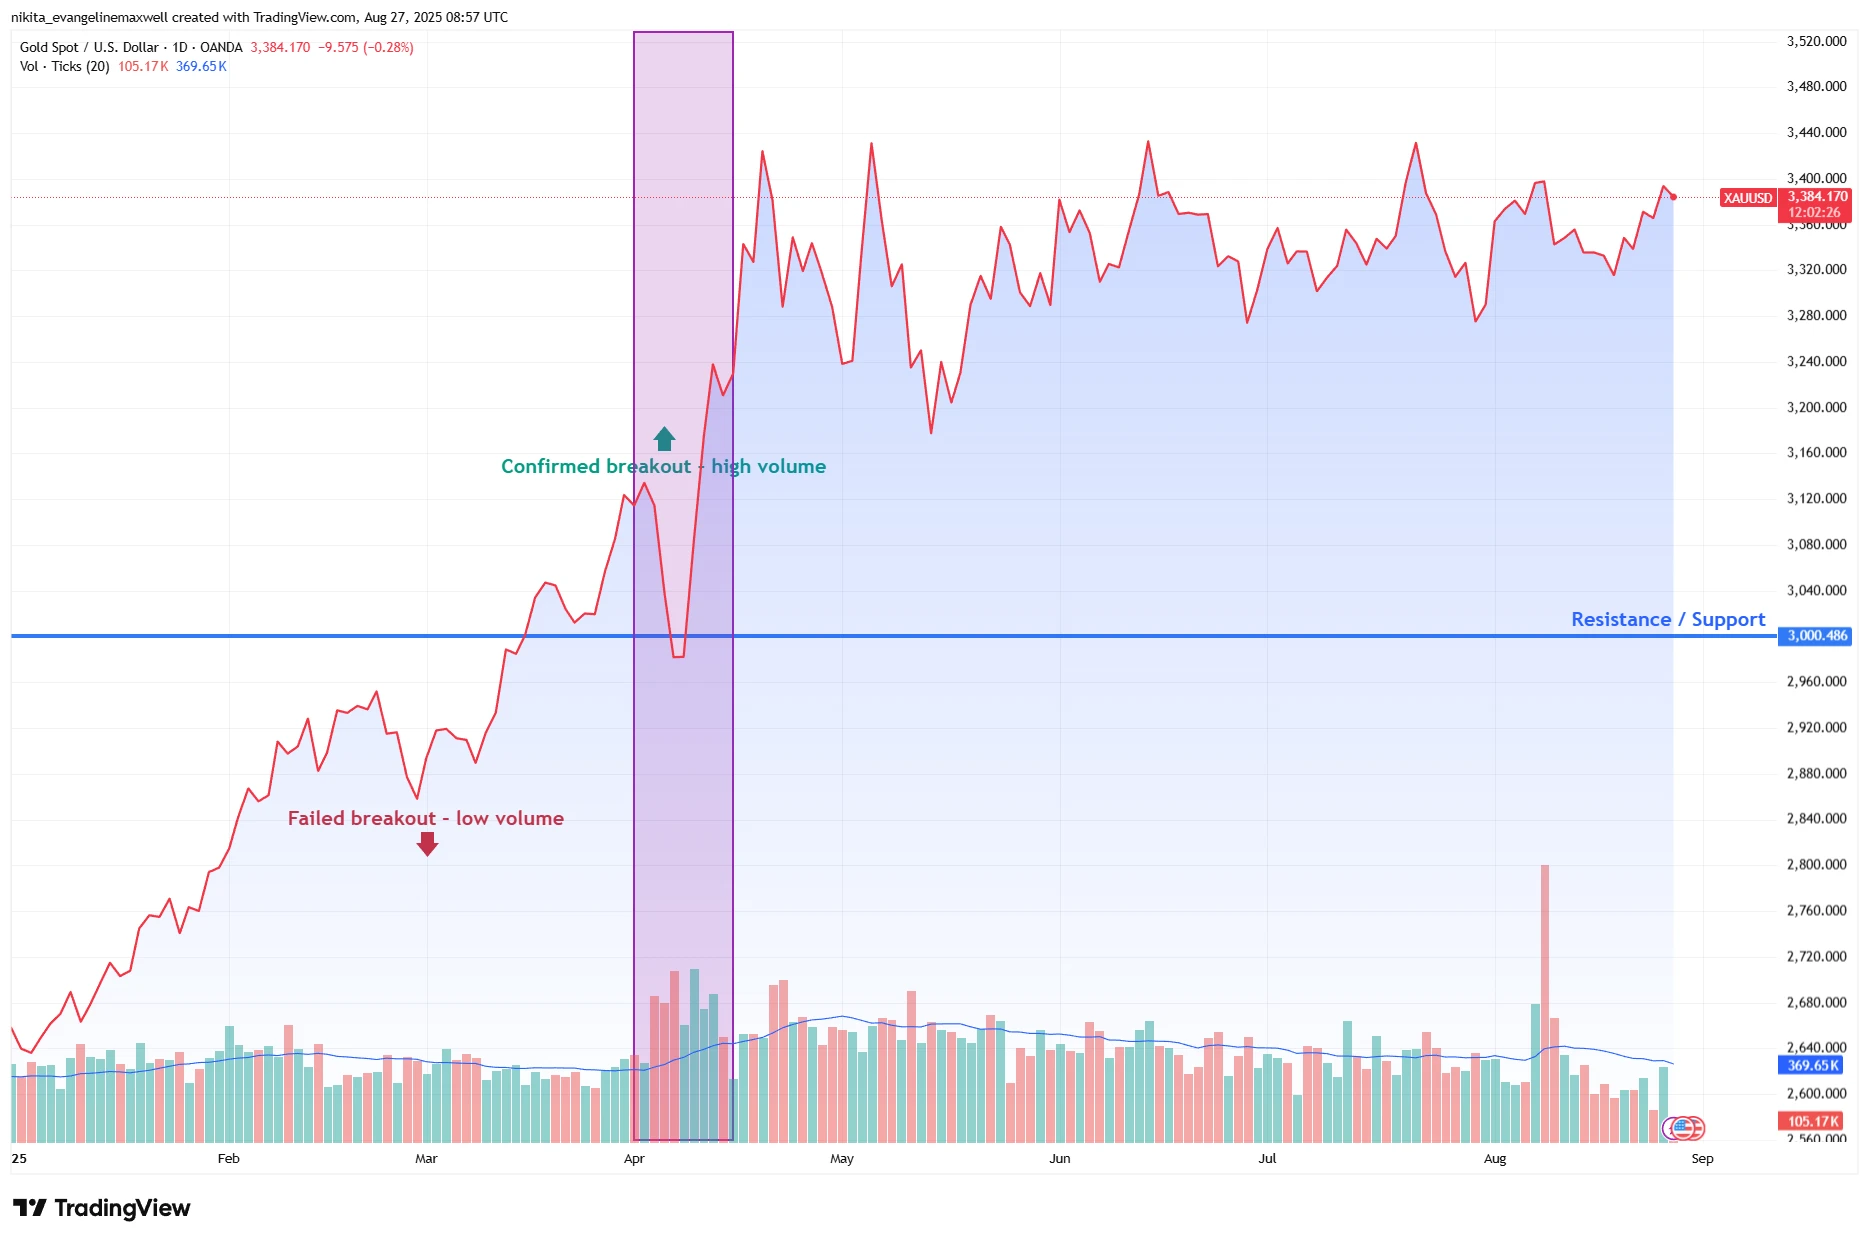
Likewise, picture gold: it approaches resistance at $3,000. In one session it touches the level and stalls on modest volume. In another, the same resistance is hit with a flurry of trading (big volume bar), pushing gold higher. In the latter case, the heavy volume proved the breakout was genuine.
Gold at $3,000: Volume Confirms Breakout

Source: TradingView. All indices are total return in US dollars. Past performance is not a reliable indicator of future performance. Data as of 27 August 2025.
Trader Tips
- Avoid False Breakouts: Always check volume on a breakout. If price clips a resistance on light volume, don’t rush in. The breakout might fail.
- Use Multiple Timeframes: Volume at one timeframe might hide the bigger picture. A level that looks thin on hourly charts may show strong volume on daily. Check weekly or monthly volume to gauge if a support or resistance is truly major.
- Combine with Other Tools: Volume is powerful, but it works best with confirmation. Pair volume spikes with candlestick patterns or trendlines. For instance, a bullish engulfing bar at support on high volume is far more convincing than without.
- Watch Volume Spikes: Sudden volume spikes often mark important moments (breakouts or reversals). Look for repeated high-volume tests of a level – that’s when you know it’s significant (lots of traders have “memory” of that price).
- Adjust Risk to Volume: When volume is high, trends can be volatile. When volume’s low, you might tighten stops or even sit out – there’s just less clarity.
Takeaway
In support-and-resistance trading, price alone can be a guess. Volume is the confirming clue. High volume at a level means “real money” supported that price, making the level count. Low volume means it’s guesswork. By making volume your “missing piece,” you turn vague lines into trustworthy levels. Always remember – volume confirms the strength of the trend. In the end, adding volume to your analysis makes every support and resistance line more reliable – and your trades more precise.