The Yield Curve Isn’t Just Flat – It’s Talking
In finance, the yield curve shows how much it costs the US government to borrow for different lengths of time. Most people hear about it only when it inverts, when short‑term rates rise above long‑term ones, because that pattern has historically appeared before recessions. But the yield curve is doing much more than flashing warnings. It is telling a story about how markets see growth, inflation, and future Fed policy.
Under normal conditions, the curve slopes upward. Investors want extra compensation to lend for longer, a buffer known as “premium”. When the curve is steep, markets are usually signalling confidence. They expect stronger growth and firmer inflation, so long‑term yields drift higher. When optimism fades, the curve flattens or slips into inversion as long yields fall or short yields rise. This usually reflects expectations for slower activity or future rate cuts.
Different parts of the curve highlight different forces.
To illustrate how the curve’s shape has shifted, here is the official Treasury par yield curve for January 2025 vs January 2026.
Comparing January 2025 and January 2026 Par Yield Curves (US Treasury Data)
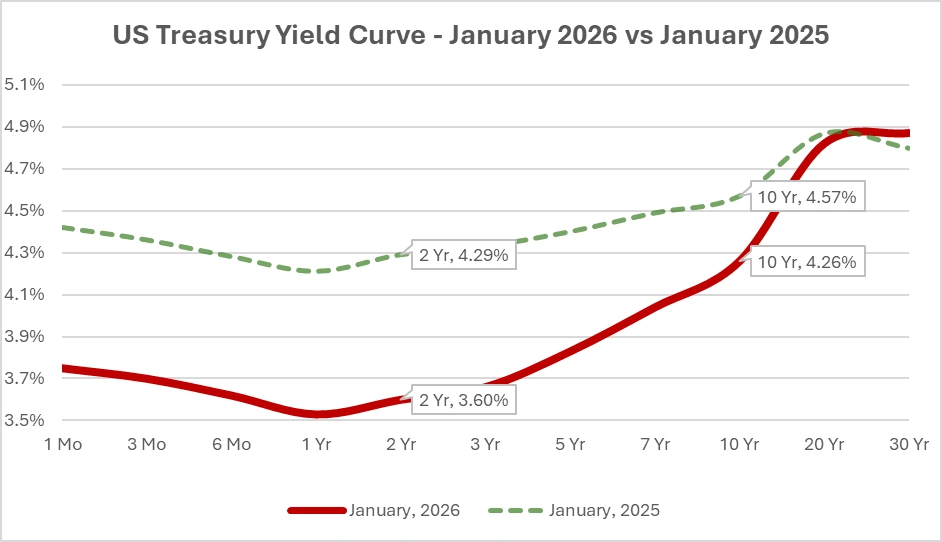
Source: U.S. Department of the Treasury, Daily Treasury Par Yield Curve Rates.
US Treasury yield curve, latest versus one year ago, showing how shifts across maturities shape the market’s outlook on growth, inflation and policy.
The drop across short maturities between January 2025 and January 2026 reflects the market’s pricing of anticipated Fed rate cuts, as investors began positioning for easier policy in response to cooling inflation.
The front end, bills through 2‑year notes, is essentially a referendum on what traders believe the Fed will do next. If investors expect rate cuts, they buy short maturities and push those yields down. This is why the 2‑year yield is often described as the market’s best indicator of future Fed moves. The well‑known 2s/10s spread tends to invert when traders expect the Fed to ease later on.
Further out, areas like the 5s/30s slice respond more to long‑term views on growth, inflation, and the direction of the term premium. These maturities are less about the upcoming Fed meeting and more about where investors believe the economy is heading in the years ahead. This longer section of the curve also reacts to structural forces such as demographic trends, global savings patterns, and swings in Treasury supply, which can influence long‑term yields even when economic data is mixed. As a result, traders often watch these maturities to judge whether the market is pricing a durable shift in economic momentum or simply reacting to temporary noise.
Curve shifts also need context. A steepening curve often reflects optimism about growth, although it can also signal trouble if the move is driven by long‑term yields jumping because of renewed inflation concerns. Inversions should not be treated as automatic recession calls either. They simply indicate that markets expect short‑term rates to fall in the future, usually because inflation is cooling or because the term premium is unusually low. In recent cycles, that lower term premium has made inversions more common and less reliable as predictors.
To understand the curve properly, traders look at it alongside other signals. Real yields, inflation breakevens, and Fed Funds futures help reveal whether a curve move is being driven by growth expectations, inflation repricing, or policy speculation. This helps explain why the curve stayed inverted while equities surged in 2023 and 2024. Investors were pricing in falling inflation and eventual rate cuts rather than an imminent downturn. Historically, stocks have often performed well during periods of inversion, and markets have frequently recovered quickly after short bursts of stress.
Bottom line: the yield curve is not a simple green‑light or red‑light indicator. A steep curve can reflect confidence in the economic outlook or concerns about inflation. A flat or inverted curve can indicate trouble or simply expectations of easier monetary policy ahead. The real signal lies in identifying which part of the curve is moving and why. Think of the yield curve as the bond market’s forward‑looking narrative about growth, inflation, and policy, not just an alarm bell.
As 2026 unfolds, markets will watch whether the curve steepens because of improving growth or because long-term inflation expectations drift higher. The distinction matters, and it will determine whether the bond market’s next message is reassuring or cautionary.