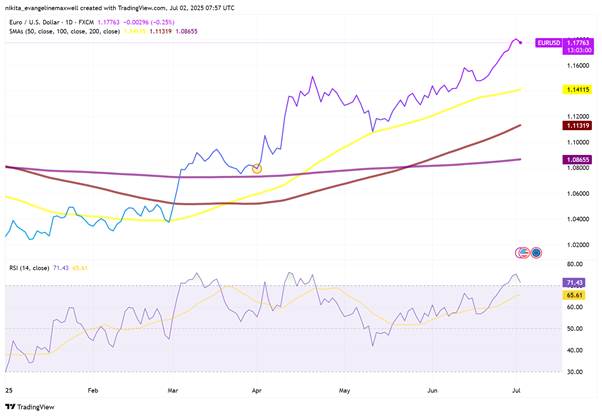
The Nasdaq-100 is back in the spotlight again. After climbing more than $23,100 so far this year, the index has pushed into uncharted territory, thanks in large part to a powerful rally in AI-linked tech stocks and solid results from the biggest names in the game. With inflation cooling and the Fed on pause, optimism is high. But at these levels, traders are starting to ask: is this the real deal, or is the rally starting to overheat?
What the Charts Are Telling Us
On the surface, the Nasdaq’s breakout looks strong. It’s cleared last year’s highs, blasting past resistance and riding above key moving averages like the 50- and 200-day. That’s usually a textbook bullish sign. But dig a little deeper, and some cracks begin to show.
Nasdaq-100 Weekly Chart – Long-Term Trend Stretches from Moving Averages
Source: TradingView. All indices are total return in US dollars. Past performance is not a reliable indicator of future performance. Data as of 23 July 2025.
RSI’s sitting just under 70 – not quite overbought, but close enough to raise eyebrows. It doesn’t mean a reversal is coming, but it does hint that the rally might be running hot.
Volume, meanwhile, hasn’t kept up. Even as prices have powered higher, trading activity has been thinning out. This kind of divergence – rising price, falling volume – isn’t ideal. Strong breakouts tend to come with strong volume behind them. When that’s missing, it could mean fewer traders are on board.
And then there’s the matter of how far price has stretched above the moving averages. That distance makes the market vulnerable to a pullback. Think of it like a rubber band, the more it stretches, the likelier it snaps back.
Nasdaq-100 Daily Chart – Momentum Builds, RSI Approaching Overbought
Source: TradingView. All indices are total return in US dollars. Past performance is not a reliable indicator of future performance. Data as of 23 July 2025.
So, while the uptrend remains intact, the chart is sending some early signals that a pause may be near!
Momentum or Burnout?
The bulls have plenty to be excited about. Big Tech earnings have been solid, AI tailwinds are strong, and the Fed’s pause is giving growth stocks breathing room. Last year, even the hint of rate cuts lit a fire under the Nasdaq. Add to that billions in inflows to tech-focused funds, and it’s not hard to see why momentum could keep going. There’s also a psychological factor: when prices break into new highs, there’s no ceiling above – no obvious resistance to slow the climb. That often draws in more buyers chasing the move.
But on the flip side, signs of exhaustion are hard to ignore.
The RSI is elevated. Volume is fading. Despite new highs, average daily volume has dipped below recent peaks – a classic sign of fading participation. And momentum indicators like MACD are starting to flatten. Some traders are also spotting what’s called bearish divergence, where prices make new highs, but momentum fails to confirm them. It’s often a hint that the rally is losing steam.
Another concern? Breadth. A handful of mega-cap stocks (hello, Nvidia and friends) are carrying the load. If the broader market isn’t joining in, it can mean the rally isn’t as healthy as it looks. Thin leadership can’t prop things up forever.
Nasdaq-100 Daily Chart – Bearish Divergence in MACD and RSI Flattening
Source: TradingView. All indices are total return in US dollars. Past performance is not a reliable indicator of future performance. Data as of 23 July 2025.
What Traders Are Watching
A dip doesn’t mean disaster, but how the market reacts to one matters.
If the Nasdaq starts pulling back, watch the recent breakout level and the 50-day moving average. A bounce from there would suggest a normal reset. But if it slices through those levels with conviction, it could open the door to something deeper.
Momentum indicators will help tell the story. If RSI slips below 60 or MACD crosses bearishly, that might confirm a momentum fade. Market breadth and volatility gauges like the VIX are also worth tracking, if they spike, it’s a signal traders are getting nervous.
Final Word
This isn’t about panic. It’s about preparation.
The Nasdaq has been on a tear, and the trend is still up. But with signs of overextension and a few warning lights flashing, this could be a good time to tighten stops, stay nimble, and let the market show its hand.