













Market Structure and Liquidity: How Traders Analyse Price Action


Financial markets can sometimes appear unpredictable, but price movements often develop within recognisable patterns known as market structure. By analysing trends, swing highs and swing lows, traders can build a clearer picture of how price is behaving.
Another important concept is liquidity. Financial markets require buyers and sellers to facilitate transactions, and certain price levels can attract increased trading activity as orders are executed. Understanding market structure and liquidity together can provide traders with broader context when analysing price behaviour.
This guide explains how market structure and liquidity work, how they interact and why traders consider them when analysing financial markets.
What Is Market Structure
Market structure describes the overall way prices move over time. Rather than focusing on every individual price movement, traders observe the sequence of highs and lows to determine whether the market is generally moving higher, lower or sideways.
Although every market behaves differently, most price action can broadly be grouped into three categories:
- Uptrend
- Downtrend
- Range
Recognising the prevailing market structure helps traders understand the broader context before analysing individual trading opportunities.
What Are Swing Highs and Swing Lows
A swing high is a temporary peak where price stops rising before moving lower. A swing low is a temporary trough where price stops falling before moving higher.
Traders analyse the exact sequence of these swing highs and swing lows to determine whether the market is trending upwards, downwards or moving sideways.
Figure 1: Swing High and Swing Low Diagram
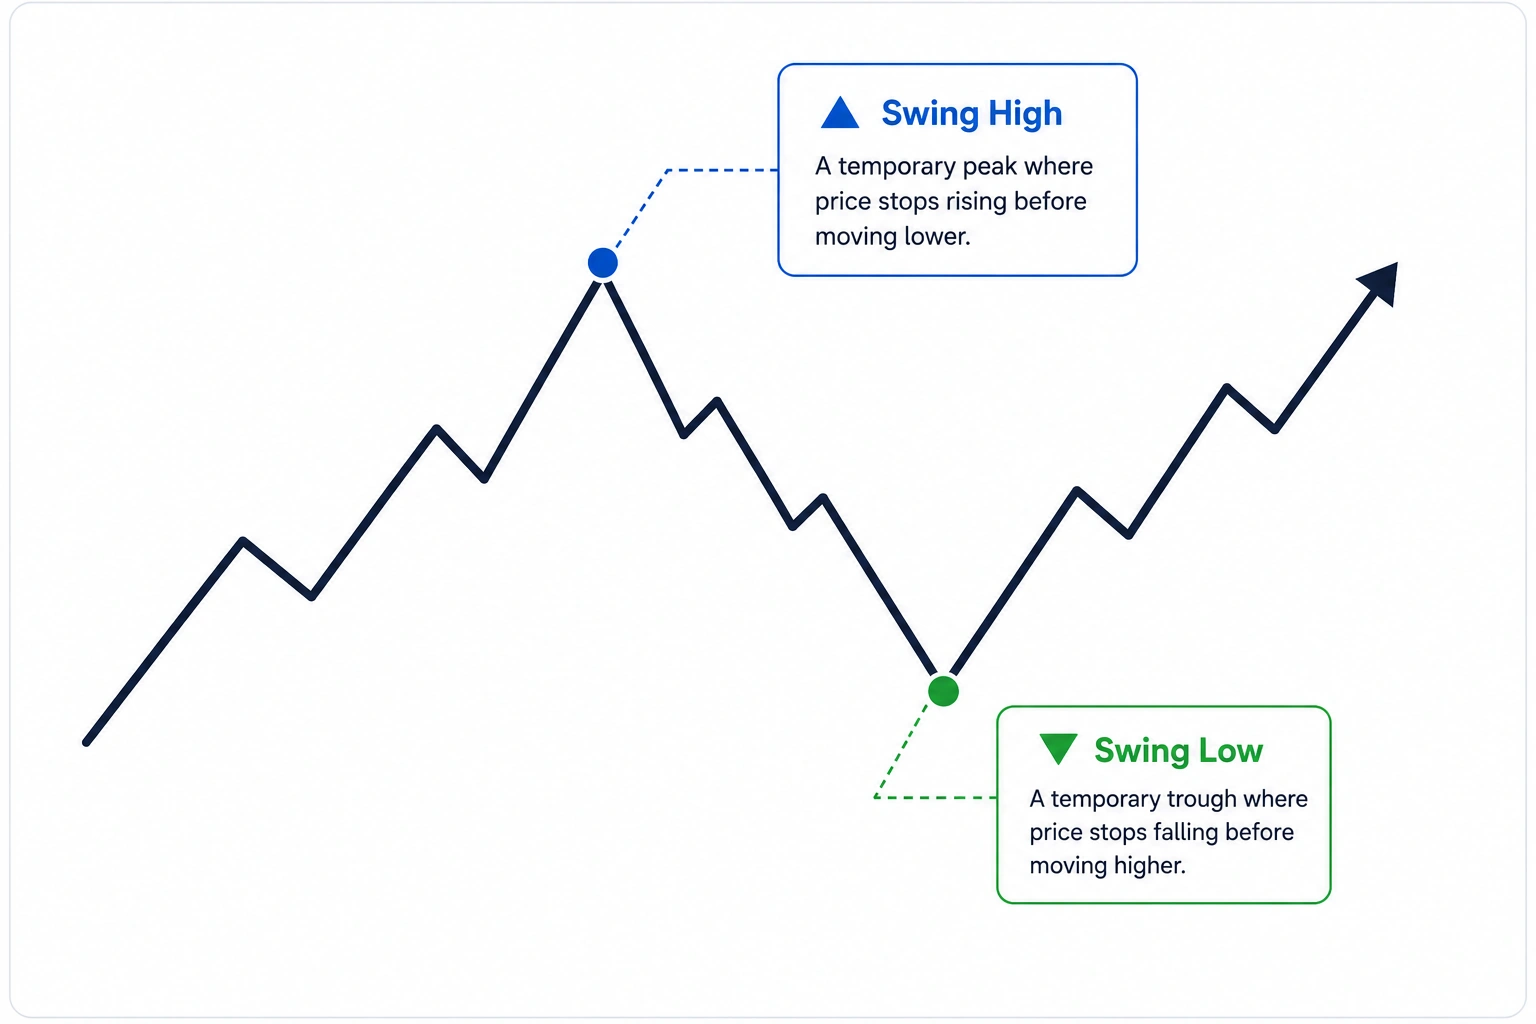
Swing highs and swing lows are temporary peaks and troughs that traders use to identify the structure and direction of price movements.
This chart is provided for illustration and educational purposes only and does not represent financial advice, trading recommendations, or actual market signals.
Bullish Market Structure
A bullish market structure develops when prices consistently create higher highs and higher lows.
Each new upward move exceeds the previous high, while each pullback remains above the previous low. This structural pattern suggests that buyers continue to maintain control after temporary periods of selling pressure.
Figure 2: Bullish Market Structure Diagram
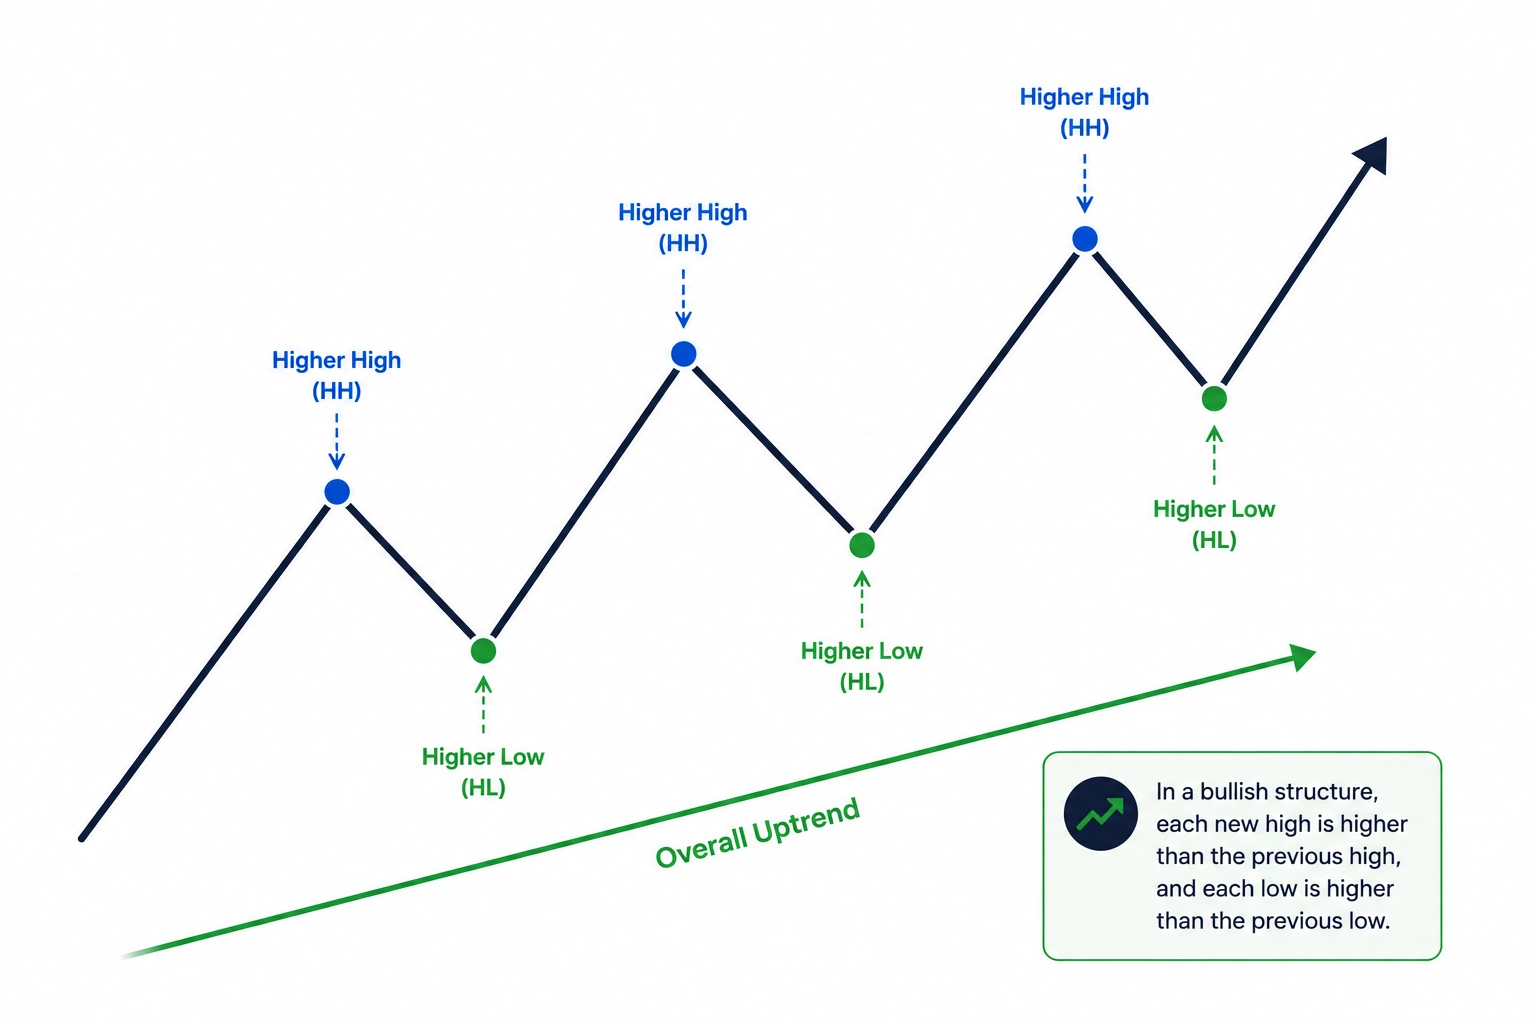
A bullish market structure develops when price forms a sequence of higher highs and higher lows.
This chart is provided for illustration and educational purposes only and does not represent financial advice, trading recommendations, or actual market signals.
Bearish Market Structure
A bearish market structure develops when prices consistently create lower highs and lower lows.
Each rally fails to exceed the previous high, while each decline moves below the previous low. This behavioural pattern suggests that selling pressure continues to outweigh buying pressure.
Figure 3: Bearish Market Structure Diagram
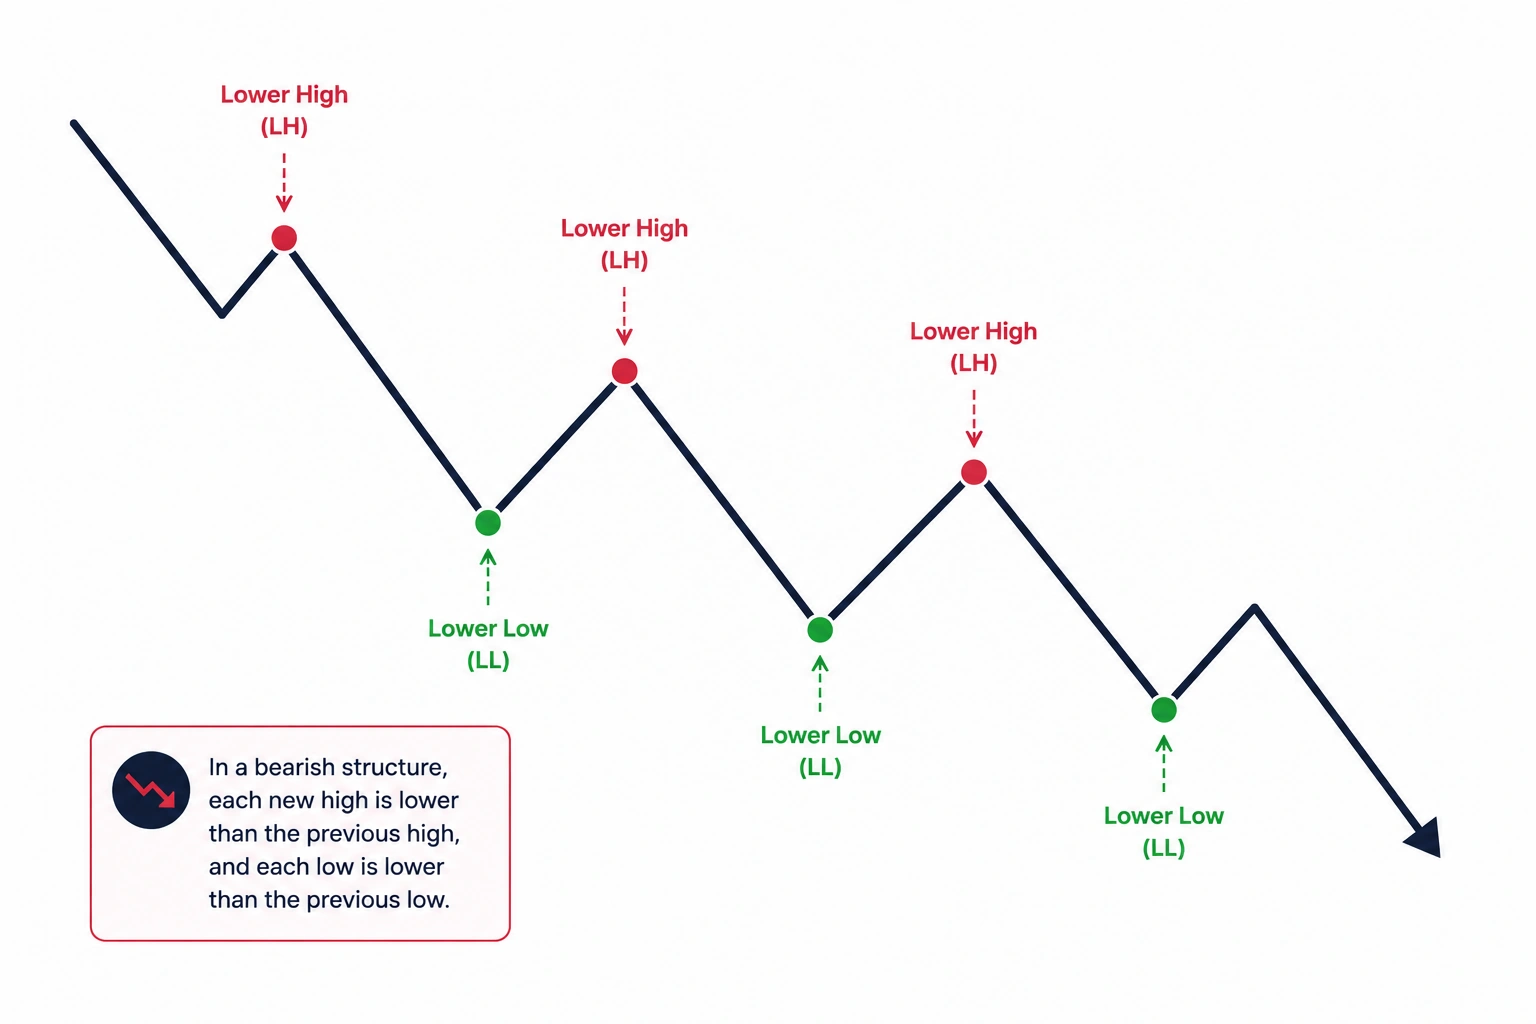
A bearish market structure develops when price forms a sequence of lower highs and lower lows.
This chart is provided for illustration and educational purposes only and does not represent financial advice, trading recommendations, or actual market signals.
Range Bound Market Structure
Markets do not always trend higher or lower. Sometimes prices move sideways within a relatively narrow range. During these periods, prices repeatedly move between support and resistance without establishing a clear long-term direction. Traders often describe these conditions as consolidation or ranging markets.
Because breakouts from a range do not always succeed, many traders wait for additional confirmation before assuming that a new trend has begun.
Figure 4: Range Bound Market Diagram
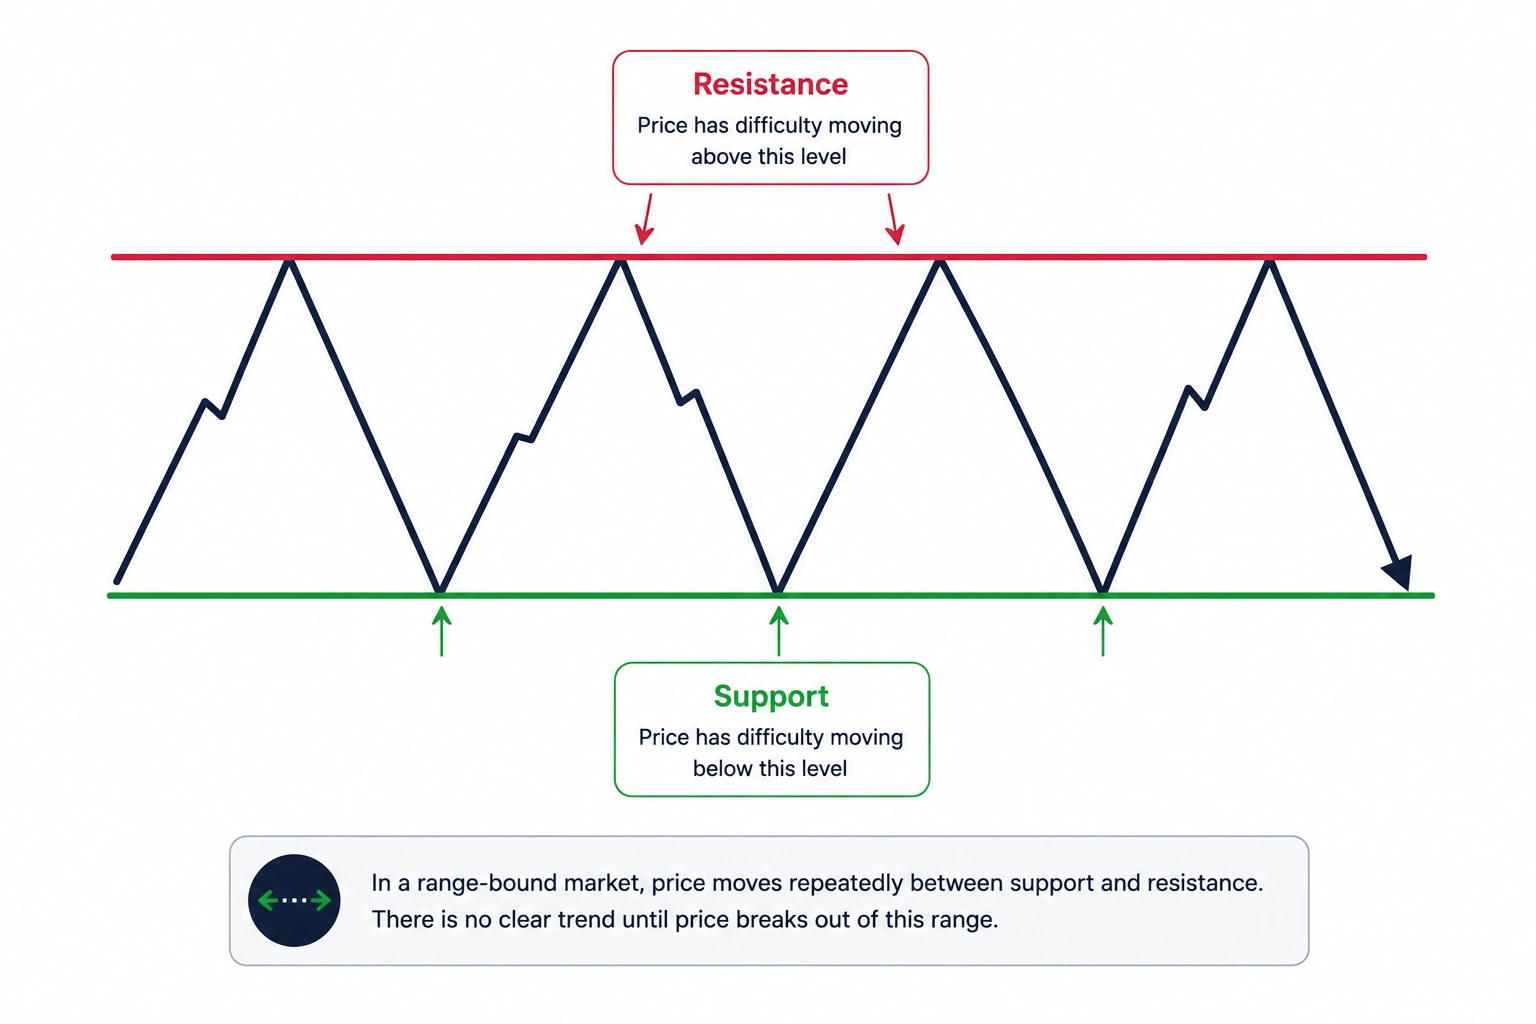
In a range-bound market, price moves between support and resistance without establishing a clear upward or downward trend.
This chart is provided for illustration and educational purposes only and does not represent financial advice, trading recommendations, or actual market signals.
What Is Liquidity
Liquidity refers to the availability of buyers and sellers willing to trade at a particular price. Highly liquid markets generally allow transactions to occur more easily because there are many participants willing to buy and sell. Less liquid markets may experience larger price movements when relatively few participants are available.
From a technical analysis perspective, traders often pay particular attention to well-known price levels such as previous highs and lows, where pending orders and stop-loss orders may be concentrated.
Why Do Traders Watch Liquidity Around Key Price Levels?
Many traders observe that prices frequently revisit previous highs, previous lows and other important technical levels. Many traders observe that prices frequently revisit previous highs, previous lows and other important technical levels. These areas can attract increased trading activity as existing orders are triggered and market participants respond to the level.
This does not mean prices will automatically reverse at these levels. Instead, traders view these areas as locations where buying and selling activity is likely to increase.
Figure 5: Liquidity Around Swing Highs and Swing Lows Diagram
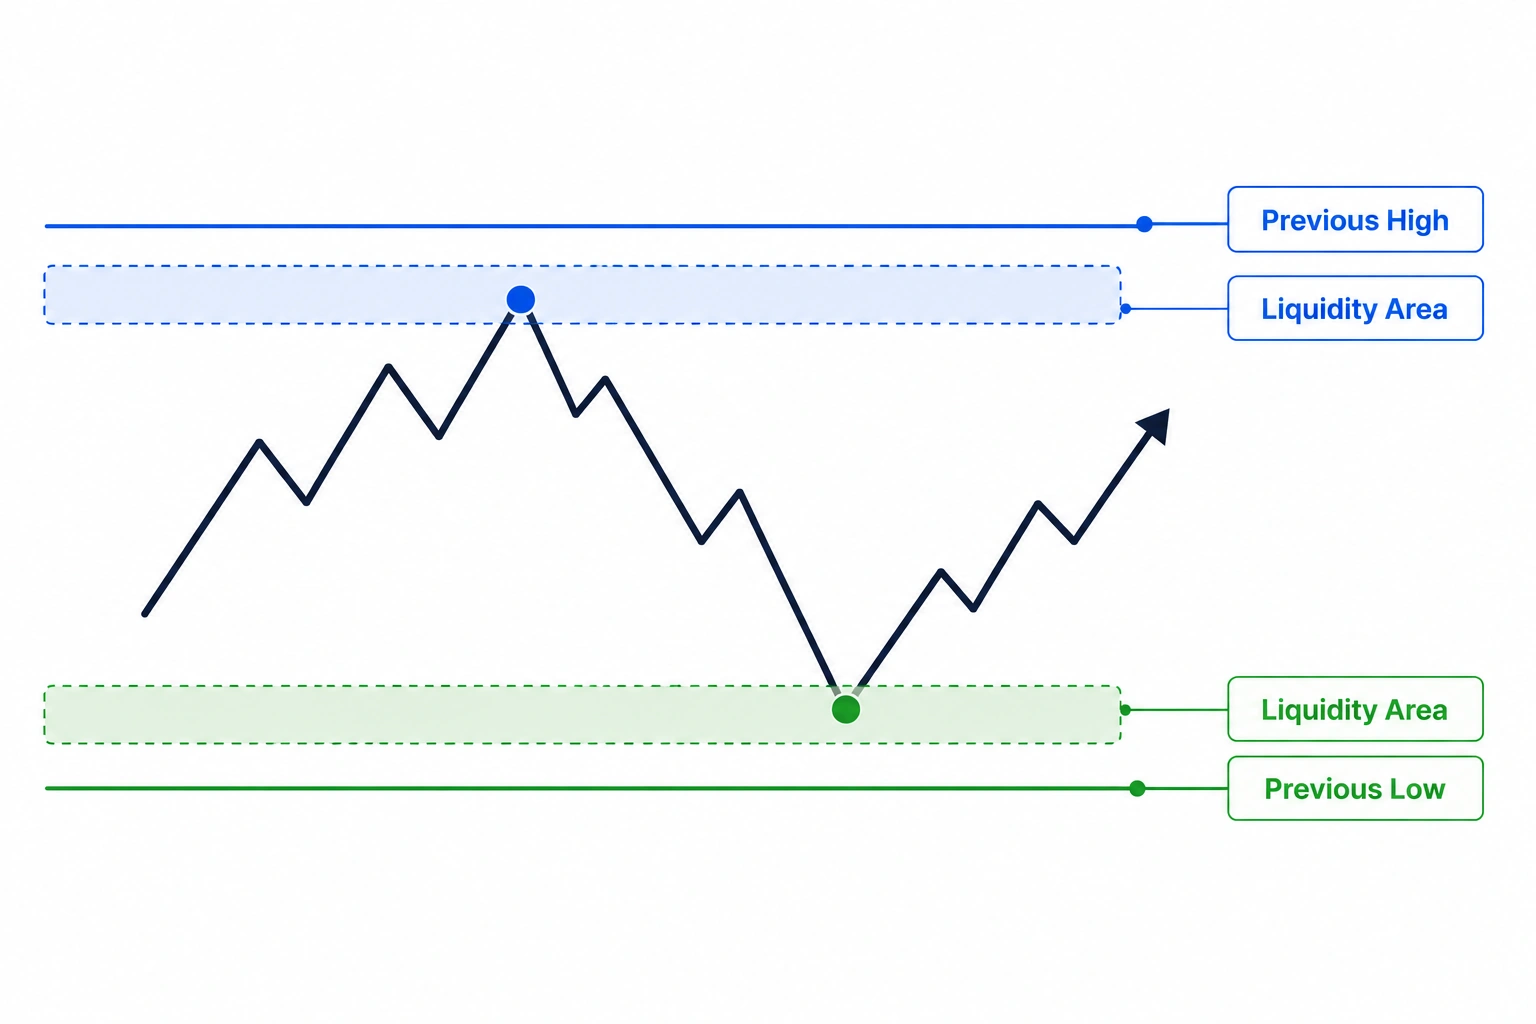
Previous swing highs and lows can become areas of interest where pending orders and stop-loss orders may be concentrated.
This chart is provided for illustration and educational purposes only and does not represent financial advice, trading recommendations, or actual market signals.
Market Liquidity Example
Imagine a company’s share price repeatedly struggles to move above £100. Some traders may place buy stop orders above this level in anticipation of a breakout, while traders holding short positions may also have stop-loss orders nearby.
If the share price eventually rises above £100, some of these orders may be triggered, increasing trading activity around that price. This illustrates why previous highs can become important areas of market interest.
Can Market Structure Predict Future Prices
No. Market structure is descriptive rather than predictive. It helps traders understand how prices have been behaving historically, but it cannot predict future price movements with certainty.
Unexpected economic data, company announcements, geopolitical developments and sudden changes in investor sentiment can all influence market direction. For this reason, market structure should be viewed as one analytical tool within a broader trading framework rather than as a guarantee of future outcomes.
Bottom Line
Market structure provides a framework for understanding how prices move over time, while liquidity helps explain why certain price levels often attract increased trading activity. By recognising trends, identifying swing highs and swing lows and understanding where buying and selling interest may increase, traders can build a clearer picture of overall market behaviour.
Rather than predicting where prices will move next, market structure and liquidity help traders understand how the market is behaving today. Used together with sound risk management and other forms of technical analysis, they provide a structured framework for analysing price action.