Why Gold Prices Matter Ahead of Rate Decisions
Gold isn’t just about jewellery or safe-haven status – it’s also one of the first places traders turn to when they want to make a macro bet. And right now, it’s at an interesting spot. Prices are hovering near all-time highs, and with the next Federal Reserve meeting just around the corner, the gold market feels… tense.
We all know how this goes: when the Fed raises interest rates, gold usually struggles. Higher rates mean stronger yields elsewhere – so investors move their money into bonds, not gold. But if the Fed hints that rate cuts are coming? That’s typically good news for gold. Lower yields make non-yielding assets like gold more attractive, and a softer dollar often follows – another tailwind for the metal.
So here we are in July 2025, and the setup is pretty clear. Gold has been climbing again after a brief pullback in June. The big question now is: will the Fed’s next statement give the rally more fuel… or hit the brakes?
What the RSI Is Telling Us in July 2025
On the daily chart, gold’s momentum has pulled back notably. As of July 9, 2025, the RSI sits around 43 – down from the high-60s seen just a few weeks earlier. This reflects a cooling in bullish momentum following a brief price correction. Gold is no longer near overbought levels, suggesting traders have dialled back expectations ahead of the Fed.
Earlier in the year, gold’s RSI crossed above 70 during a rally to all-time highs in April. After that, the price cooled off and RSI dropped into the 40s – much like we’re seeing again now. In June, gold rebounded, briefly pushing RSI higher, but this latest drop suggests momentum is again fading.
At this point, with RSI closer to 40 than 70, gold isn’t in the “watch zone” for an overbought signal. Instead, it’s nearing the lower midrange, where traders may start looking for signs of reacceleration – or further downside if bearish sentiment builds.
Gold Spot (XAU/USD) – Daily Chart with 14-Day RSI and SMA 50/100/150
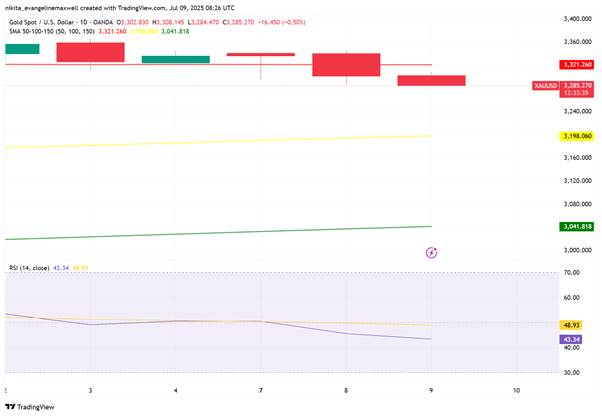
Source: TradingView. All indices are total return in US dollars. Past performance is not a reliable indicator of future performance. Data as of 9 July 2025.
What the RSI Might Be Telling Us
Gold is heading into the July Fed meeting at a critical juncture – and the RSI could offer early clues on what’s next.
If the Fed leans dovish, hinting at future rate cuts or concern about the economy, gold could get a fresh push higher. That kind of move might lift the RSI back above 70, a level that signals strong momentum but also warns the rally may be overheating. A quick move into overbought territory often brings some profit-taking shortly after.
On the other hand, if the Fed strikes a more cautious or hawkish tone – suggesting rates will stay higher for longer – traders may start to pull back. In that case, the RSI could dip below 50, which usually signals fading bullish momentum and opens the door to a deeper correction.
There’s also a third signal to watch for: divergence. If gold climbs to a new high but RSI doesn’t follow, that’s often a red flag. It suggests fewer traders are behind the move – and that momentum might be running thin.
Final Take
The Fed isn’t expected to cut rates this month, but even a slight shift in tone could move markets. Gold has had a solid run, and RSI is still holding up – but it’s near levels that have triggered pullbacks before. For now, the indicator reflects optimism, but with a hint of caution. Traders would be wise to let price and momentum speak after the Fed’s message lands.