Tesla stock just delivered its sharpest breakout in months – but the technicals are sending mixed signals.
After weeks of underperformance and investor caution, Tesla (TSLA) has surged past a key long-term technical level: the 200-day moving average. Tesla’s latest surge has reignited hopes of a turnaround, especially after months of uneven performance. Still, with market volatility lingering and some underlying concerns about the business, investors aren’t rushing in blindly.
Tesla Reclaims Its Long-Term Trendline
The stock price of Tesla reached $362.89 on 27 May after a 7% surge which represented its biggest weekly increase. The stock price exceeded the 200-day moving average ($300.06) which serves as a crucial indicator for traders to assess long-term market strength.
The moving average represents the stock's average closing price during a period of approximately 10 months. The moving average serves as a widely used benchmark because it eliminates short-term price movements to show long-term market direction. It filters out short-term noise and shows whether an asset is generally trending up or down. When price crosses above it from below, it’s often interpreted as a bullish signal – a sign that buying pressure may be returning.
TSLA 200-day moving average
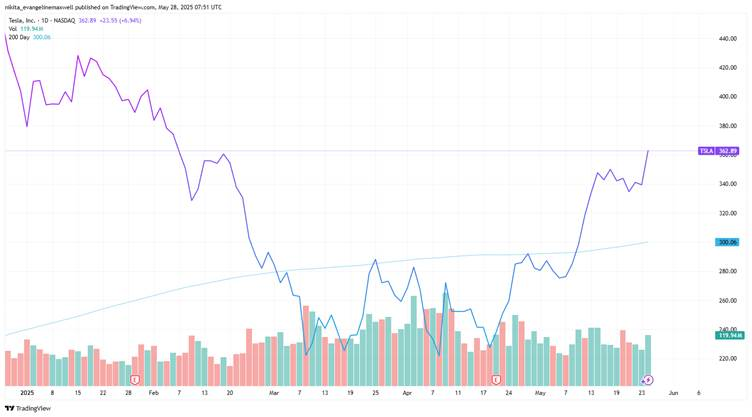
Source: TradingView. All indices are total return in US dollars. Past performance is not a reliable indicator of future performance. Data as of 28 May 2025.
Tesla had been trading below this line since earlier in the year in March and April, with investor sentiment dented by weak overseas sales and CEO Elon Musk’s involvement in multiple ventures. This breakout marks a potential turning point.
Momentum Indicators Offer Mixed Messages
Even with the strong move, some key indicators suggest this rally may be getting ahead of itself – at least in the short term.
RSI (Relative Strength Index): Tesla’s daily RSI is currently around 68, approaching overbought territory. While it hasn’t crossed the traditional threshold of 70 just yet, it suggests that the stock is gaining momentum rapidly – but may face resistance or consolidation in the near term. In technical terms, an RSI nearing 70 often precedes short-term pauses, especially after a sharp price rally, as seen in Tesla’s recent move above its 200-day moving average.
TSLA 1-day RSI
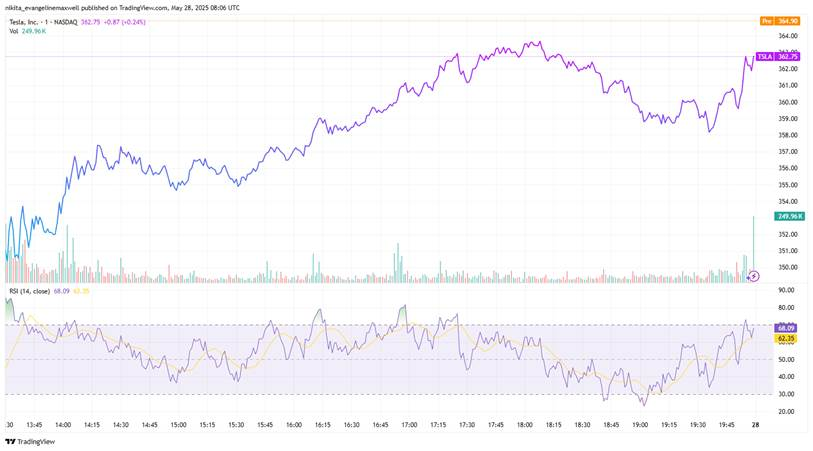
Source: TradingView. All indices are total return in US dollars. Past performance is not a reliable indicator of future performance. Data as at 28 May 2025.
Volume: Trading activity has also spiked, with volume running higher than usual. When price jumps are backed by rising volume, it’s often a sign that market participants believe in the move.
Resistance: Tesla’s rally on 27 May stalled just under $364, where the stock hit resistance twice during the week. If it manages to break and close above this level, it could unlock further upside. But repeated failure here might prompt a short-term pullback.
TSLA’s Resistance (27 May 2025)
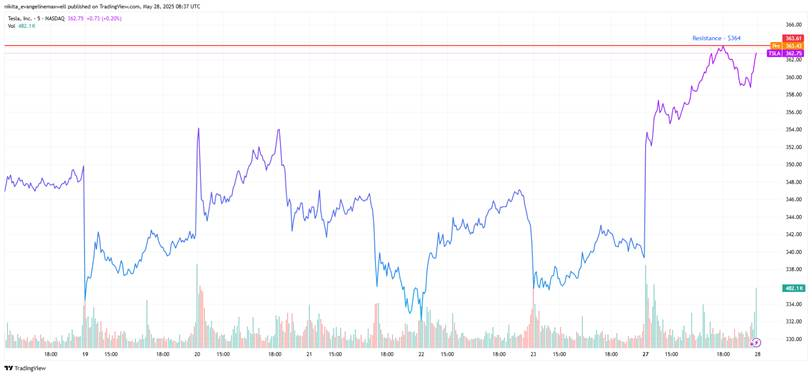
Source: TradingView. All indices are total return in US dollars. Past performance is not a reliable indicator of future performance. Data as at 28 May 2025.
News Flow Boosts Sentiment — But Risks Remain
The timing of Tesla’s breakout wasn’t coincidental. Several headlines have helped buoy investor optimism:
Elon Musk has tried to reassure investors by saying he’s once again dedicating his full focus to Tesla. That message appears to have landed well with the market, at least for now.
But there are still doubts. The analysts who support Tesla's AI and autonomous driving expansion believe it will lead to future growth but others worry about European sales decline and Cybertruck production delays.
The recent price surge may have been boosted by short-covering activity where investors who had placed bets against the stock purchased it back to drive prices upward.
Fundamentally, it’s still a mixed picture. Margins are under pressure, global EV competition is heating up, and not everyone is convinced the worst is over.
Key Levels to Watch
- Support: The 200-day moving average is currently around $297, and it continues to act as a key support level. As long as Tesla holds above this line, the long-term bullish structure remains intact. A sustained breakdown below it would signal weakness and could invite further downside pressure.
- Resistance: On the upside, Tesla has tested the $364–$365 area twice but failed to hold above it. That zone now serves as immediate resistance. However, traders are still eyeing the $370–$375 range as the next major resistance zone.
Bottom Line
Tesla’s technical breakout above its 200-day moving average is an encouraging sign — and the volume and price action suggest it’s more than just noise. For now, momentum is on the bulls’ side, helped by Musk’s renewed commitment and improving market sentiment.
But caution is still warranted. The rally faces potential obstacles in the upcoming weeks because of overbought conditions and macro uncertainty and mixed fundamentals. The market will determine if this represents a turning point or another temporary bounce based on upcoming events particularly around $370 resistance zone.
In a market that’s still finding its footing, the smartest move is watching Tesla’s chart as closely as its headlines.