The price of gold reached its highest point at $3,500 per ounce during April before returning to the $3,300 range. The price increase was mainly caused by investors seeking safe-haven assets during periods of worldwide uncertainty and when the dollar value decreased. People typically view gold as a protective asset which they choose during market instability. The dollar recovery together with decreasing market concerns led to a price drop after the first price surge.
So, is this a temporary pullback or a warning sign of something bigger? Let’s break it down using a few simple technical tools that traders often rely on.
Gold Price (Jan to Apr 2025)
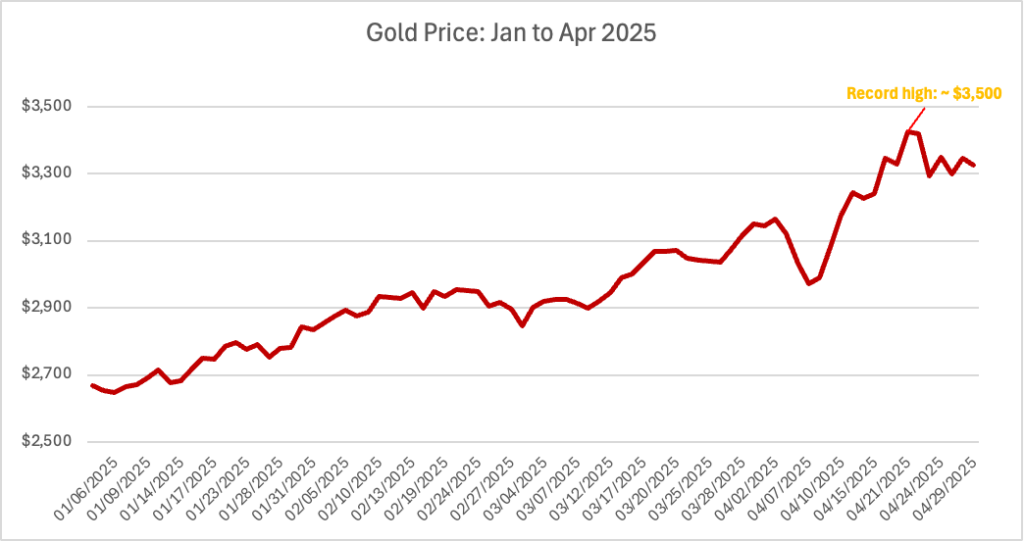
Source: Investing.com. All indices are total return in US dollars. Past performance is not a reliable indicator of future performance. Data as of 29 April 2025.
Support and Resistance: What They Mean
Think of support as the “floor” where prices tend to stop falling, and resistance as the “ceiling” that prices struggle to break through. These zones are shaped by market psychology – when prices drop to a certain level and bounce repeatedly, traders view that as support. The same goes for resistance on the way up.
For gold:
- Support is currently around $3,300 and $3,260.
- Resistance is around $3,385 and the all-time high of $3,500.
If gold bounces from $3,260 and climbs again, it suggests buyers are stepping in and still believe in the rally. But if it breaks below that level, it may open the door to more selling pressure and deeper declines. These are key zones that traders and investors alike are watching closely.

Momentum Check: RSI and MACD Explained
Technical analysts use indicators to determine the strength level of market movements. RSI and MACD serve as two of the most frequently used indicators in technical analysis.
- The Relative Strength Index functions as a speedometer which measures price change movements. The indicator exists between two limits which are 0 and 100. The asset appears overbought when its RSI value exceeds 70 because it has experienced excessive rapid price increases. Below 30? The asset shows signs of being oversold at this point and may need a price recovery. The RSI indicator for gold shifted away from the over 70 range into neutral ground which indicates the previous price surge lost momentum. The gold price continues to rise but at a reduced rate which indicates its strength has diminished.
- The Moving Average Convergence Divergence indicator evaluates trend strength by comparing two moving averages. The MACD line crossing below its signal line typically indicates decreasing momentum in the market. The MACD indicator for gold remains positive but shows signs that the powerful upward momentum may be weakening.
These indicators assist traders in determining whether they are entering a trend at its beginning or after it has already gained momentum.
So, What Could Happen Next?
The market has two possible directions for gold to move in the future.
- Bullish scenario: The price of gold will rise again if it stays above $3,260. The price of gold may reach $3,385 and possibly break through the $3,500 record. The recent dip may have been a temporary pause in the market and buyers are still in control.
- Bearish scenario: If gold falls below $3,260, the next stop could be $3,200. This would hint at fading confidence and possibly more downside. Traders may become cautious at this point or seek alternative safe-haven assets.
So, Why Should You Care?
Even if you're not trading gold yourself, these moves reflect bigger shifts in investor sentiment. Gold often signals what’s happening beneath the surface – whether markets are nervous, hopeful, or hedging their bets.
Bottom Line
Gold had a strong start to the year, and April was explosive. But after climbing too high too fast, a correction kicked in. Right now, it’s unclear whether that was just a pause or the beginning of a trend reversal.
Watching how gold behaves around these technical levels – and how momentum indicators evolve – can offer useful insight, even for long-term investors.
Key Takeaways
- Gold hit a record high in April 2025 and has since pulled back to the $3,300 range.
- Key levels: Support at $3,260 and resistance at $3,385 and $3,500.
- RSI has cooled off, while MACD hints that bullish momentum may be fading.
- If gold holds above support and rallies, we could see another run higher. If not, a deeper correction could follow.
Whether you’re an active trader or a long-term investor, it pays to keep an eye on these signals. Gold’s story isn’t over – it’s just reached a new chapter.