It’s one of the simplest lines on a chart – but it’s also one of the most powerful.
As US indices hover near record highs, Bitcoin pushes past $100K, and Tesla regains momentum, one question keeps coming up: Are markets still healthy, or are we heading for a fall?
To answer that, many traders turn to the 200-day moving average – a long-term trendline that has quietly become one of the most reliable technical indicators in modern markets.
Why Does the 200-Day Moving Average Matter?
The 200-day moving average (200-DMA) tracks the average closing price of an asset over the past 200 trading days – roughly 10 months. It filters out short-term noise and reveals the bigger trend.
When prices stay above the 200-DMA, it signals long-term strength.
When prices fall below, it often warns of weakening sentiment – and has historically preceded corrections.
This isn’t just theory. From hedge funds to retail investors, the 200-DMA is watched closely across equities, crypto, and commodities. And right now, some of the world’s biggest assets are hovering right near it.
Market Snapshot: Where Do Key Assets Stand?
S&P 500 (SPX): Holding Above – But Keep an Eye Out
The S&P 500 is currently trading near $5,940, while its 200-day moving average – a widely watched long-term trend line – sits around $5,368. This gap shows the market is still in an overall uptrend. The market's recent price fluctuations and interest rate and inflation uncertainties have investors closely monitoring this level. A drop below the 200-day line would indicate decreasing confidence which could lead to major market movements.
S&P 500 200-day moving average
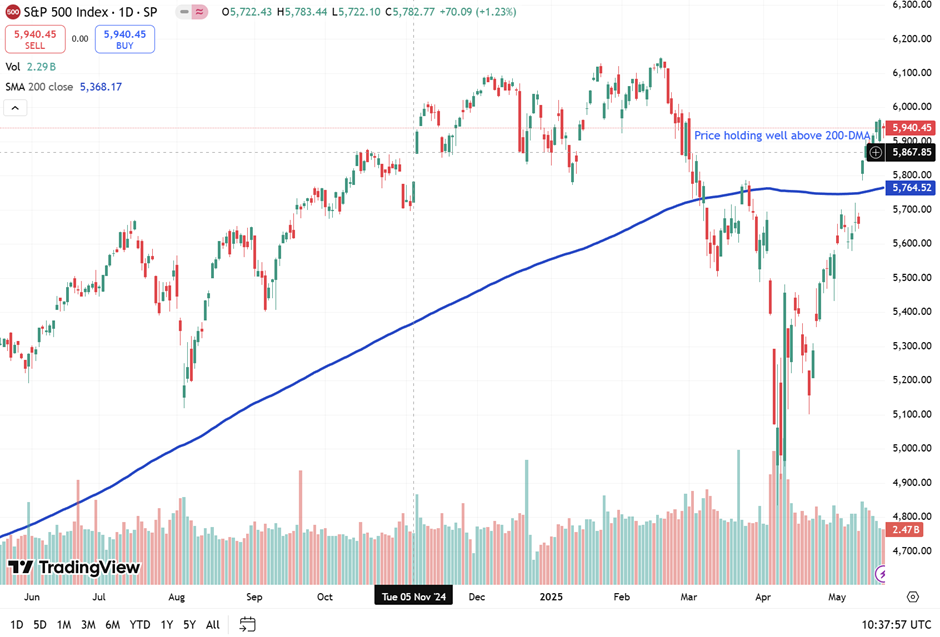
Source: TradingView. All indices are total return in US dollars. Past performance is not a reliable indicator of future performance. Data as of 20 May 2025.
Tesla (TSLA): Rebounding for Now – But Watch the Line
Tesla recently bounced off its 200-day moving average near $297 and has since climbed to around $344 – a gain of over 15%. The bounce indicates that buyers are returning to the market which could indicate a change in market direction. The price dropping below that important level would indicate that the rally is losing its strength. The 200-day line serves as a long-term support level for many traders so maintaining its position above it helps traders maintain their confidence.
Tesla 200-day moving average
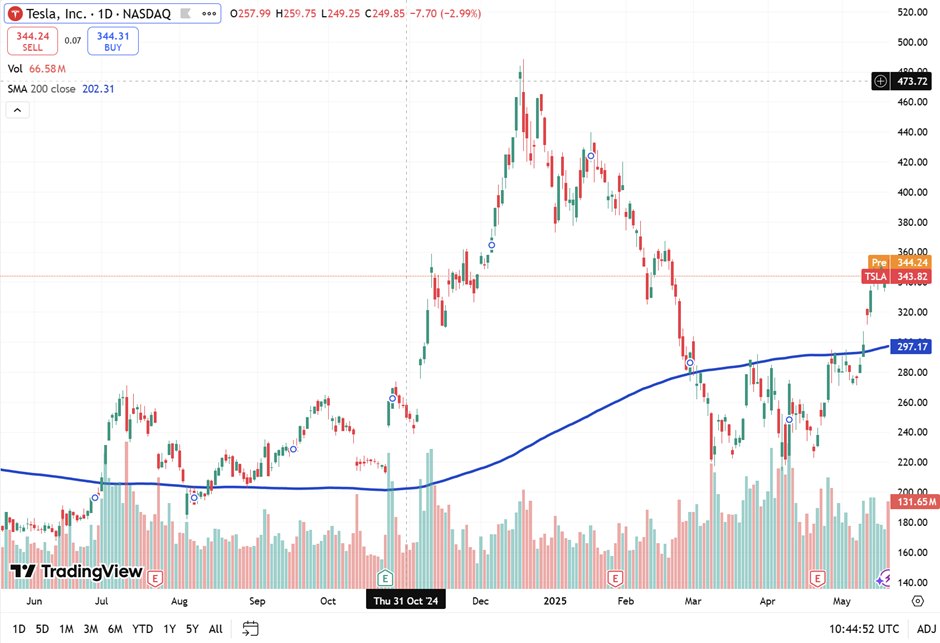
Source: TradingView. All indices are total return in US dollars. Past performance is not a reliable indicator of future performance. Data as of 20 May 2025.
Bitcoin (BTC): Well Above Support – But Watch for a Cooldown
Bitcoin is currently trading near $106,000, while its 200-day moving average – a line that tracks the long-term trend – sits around $83,700. The large price gap indicates strong upward momentum but it also indicates that Bitcoin may be rising too quickly. When prices move far above this trendline, they often pull back before continuing higher. If the price starts to dip, a return toward that 200-day line wouldn’t be surprising – especially if broader market uncertainty increases.
Bitcoin 200-day moving average
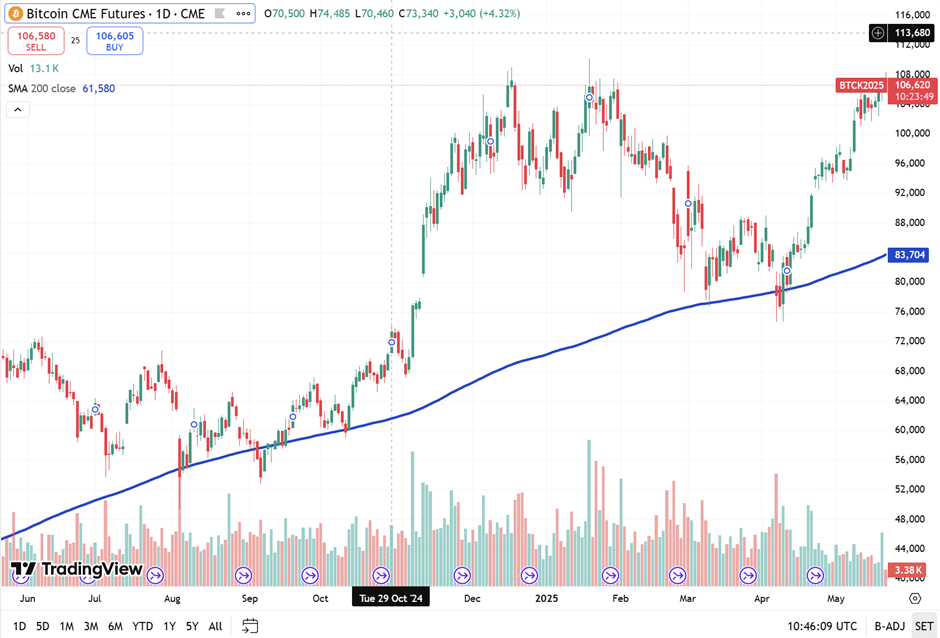
Source: TradingView. All indices are total return in US dollars. Past performance is not a reliable indicator of future performance. Data as of 20 May 2025.
What History Tells Us
The 200-DMA has served as a primary indicator throughout various market cycles:
· The S&P 500 started its sharp price drop when it fell below its 200-DMA during 2022.
· Assets that returned to their 200-DMA after a pullback during previous bull markets achieved 8-10% returns throughout the following year.
In short: when respected, the line supports rebounds. When broken, it often warns of trouble ahead.
What Traders Should Watch Now
The 200-DMA functions as both a protective barrier and an early warning system during the current earnings season and uncertain rate policy environment. Here’s what to look for:
- Breaks below the line on high volume → potential trend change
- Rebounds from the line → signal of buyer strength
- Wider gap from the 200-DMA → growing risk of correction if momentum fades
Bottom Line
Markets may be calm on the surface, but technical indicators like the 200-day moving average suggest a deeper story.
For now, major names like the S&P 500, Tesla, and Bitcoin are still above water – showing resilience. But if that changes, the 200-DMA will be among the first to spot the shift.
In a market this uncertain, watching one simple line might be the smartest move you make.