


Indikator Teknikal Dijelaskan (RSI, MACD dan Stochastic)
Indikator teknikal adalah salah satu alat yang paling banyak digunakan dalam analisis teknikal. Indikator ini membantu trader menginterpretasikan momentum, kekuatan tren, dan perubahan kondisi pasar menggunakan perhitungan berdasarkan data harga. Meskipun indikator tidak dapat memprediksi masa depan, indikator dapat memberikan konteks tambahan yang membantu trader membuat keputusan yang lebih terinformasi. Tiga indikator paling populer adalah Relative Strength Index (RSI), Moving Average Convergence Divergence (MACD), dan Stochastic Oscillator.
Setelah mempelajari tentang support dan resistance serta memahami cara kerja trendline dan channel, banyak trader mulai mengeksplorasi lapisan berikutnya dari analisis teknikal ini.
Apa Itu Indikator Teknikal?
Indikator teknikal adalah perhitungan matematis berdasarkan pergerakan harga dan, dalam beberapa kasus, volume perdagangan. Anggap saja sebagai lapisan informasi tambahan, bukan bola kristal.
Bayangkan indikator teknikal seperti instrumen di dashboard mobil. Sementara kaca depan menunjukkan kondisi jalan secara langsung, speedometer, pengukur bahan bakar, dan sensor tekanan ban memberikan data yang telah diolah untuk membantu Anda mengambil keputusan berkendara yang lebih aman. Indikator teknikal berfungsi serupa pada grafik harga.
Karena indikator sepenuhnya didasarkan pada data harga, indikator dapat diterapkan pada berbagai kelas aset, termasuk saham, mata uang, komoditas, indeks, dan kripto.
Meskipun ada ratusan indikator yang tersedia, banyak trader hanya fokus pada beberapa alat yang paling umum digunakan.
Tiga Indikator Populer
1. Relative Strength Index (RSI)
Relative Strength Index, atau RSI, adalah indikator momentum yang mengukur kecepatan dan perubahan pergerakan harga terbaru.
RSI ditampilkan sebagai satu garis yang berfluktuasi pada skala dari 0 hingga 100.
Trader umumnya menggunakan RSI untuk mengidentifikasi kapan suatu aset telah bergerak kuat ke satu arah dan apakah momentum mulai melemah.
Overbought (Di Atas 70)
Mengindikasikan bahwa momentum beli sangat kuat dan aset mungkin sudah terlalu tinggi dalam jangka pendek.
Oversold (Di Bawah 30)
Menunjukkan bahwa tekanan jual sangat intens dan momentum mungkin mulai melemah.
Namun, overbought tidak otomatis berarti harga harus turun, dan oversold tidak menjamin harga akan naik. Tren yang kuat dapat tetap overbought atau oversold dalam waktu yang lama.
Banyak trader menggunakan RSI untuk memantau momentum, bukan langsung mengasumsikan pembalikan harga pasti terjadi.
2. Moving Average Convergence Divergence (MACD)
Meski namanya panjang, MACD dirancang untuk membantu trader mengidentifikasi perubahan momentum dan arah tren.
Indikator ini terdiri dari dua garis, yaitu garis MACD dan garis Sinyal, serta histogram di tengahnya.
Trader sering memantau interaksi antara elemen-elemen ini untuk menilai apakah momentum sedang berubah.
Bullish Crossover
Ketika garis MACD yang lebih cepat melintasi di atas garis Sinyal, beberapa trader menganggap ini sebagai tanda bahwa momentum naik mungkin sedang menguat.
Bearish Crossover
Ketika garis MACD melintasi di bawah garis Sinyal, beberapa trader menganggap ini sebagai tanda bahwa momentum turun mungkin sedang meningkat.
Histogram membantu memvisualisasikan kekuatan momentum dengan mengukur jarak antara kedua garis tersebut. Batang yang lebih besar menunjukkan momentum yang menguat, sedangkan batang yang lebih kecil dapat mengindikasikan momentum mulai melambat.
Tidak seperti RSI, MACD tidak bergerak dalam batas tetap. Sebaliknya, MACD berfokus pada hubungan antara moving average dan bagaimana momentum berkembang seiring waktu, sehingga menjadi salah satu indikator tren paling populer.
3. Stochastic Oscillator
Stochastic Oscillator adalah indikator momentum lain yang membandingkan harga penutupan suatu aset dengan rentang perdagangan terbarunya.
Seperti RSI, indikator ini melacak kondisi overbought dan oversold pada skala 0 hingga 100, tetapi menggunakan dua garis yang dikenal sebagai %K dan %D.
Karena Stochastic Oscillator sangat sensitif terhadap pergerakan harga jangka pendek, batas ambang tradisionalnya sedikit lebih lebar dibandingkan RSI.
Overbought (Di Atas 80)
Mengindikasikan aset diperdagangkan di dekat batas atas rentang terbarunya.
Oversold (Di Bawah 20)
Menunjukkan aset diperdagangkan di dekat batas bawah rentang terbarunya.
Stochastic cenderung bereaksi lebih cepat terhadap pergerakan harga jangka pendek, sehingga dapat menghasilkan sinyal lebih sering.
Sensitivitas yang lebih tinggi ini kadang-kadang dapat menghasilkan lebih banyak sinyal palsu selama periode volatilitas tinggi, itulah sebabnya indikator ini sering digunakan pada pasar yang bergerak sideways atau dalam rentang.
Indikator Teknikal dalam Praktik
Gambar 1 menunjukkan Emas (XAU/USD) bersama dengan Relative Strength Index (RSI), Moving Average Convergence Divergence (MACD), dan Stochastic Oscillator.
Emas (XAU/USD): Ilustrasi Indikator RSI, MACD, dan Stochastic
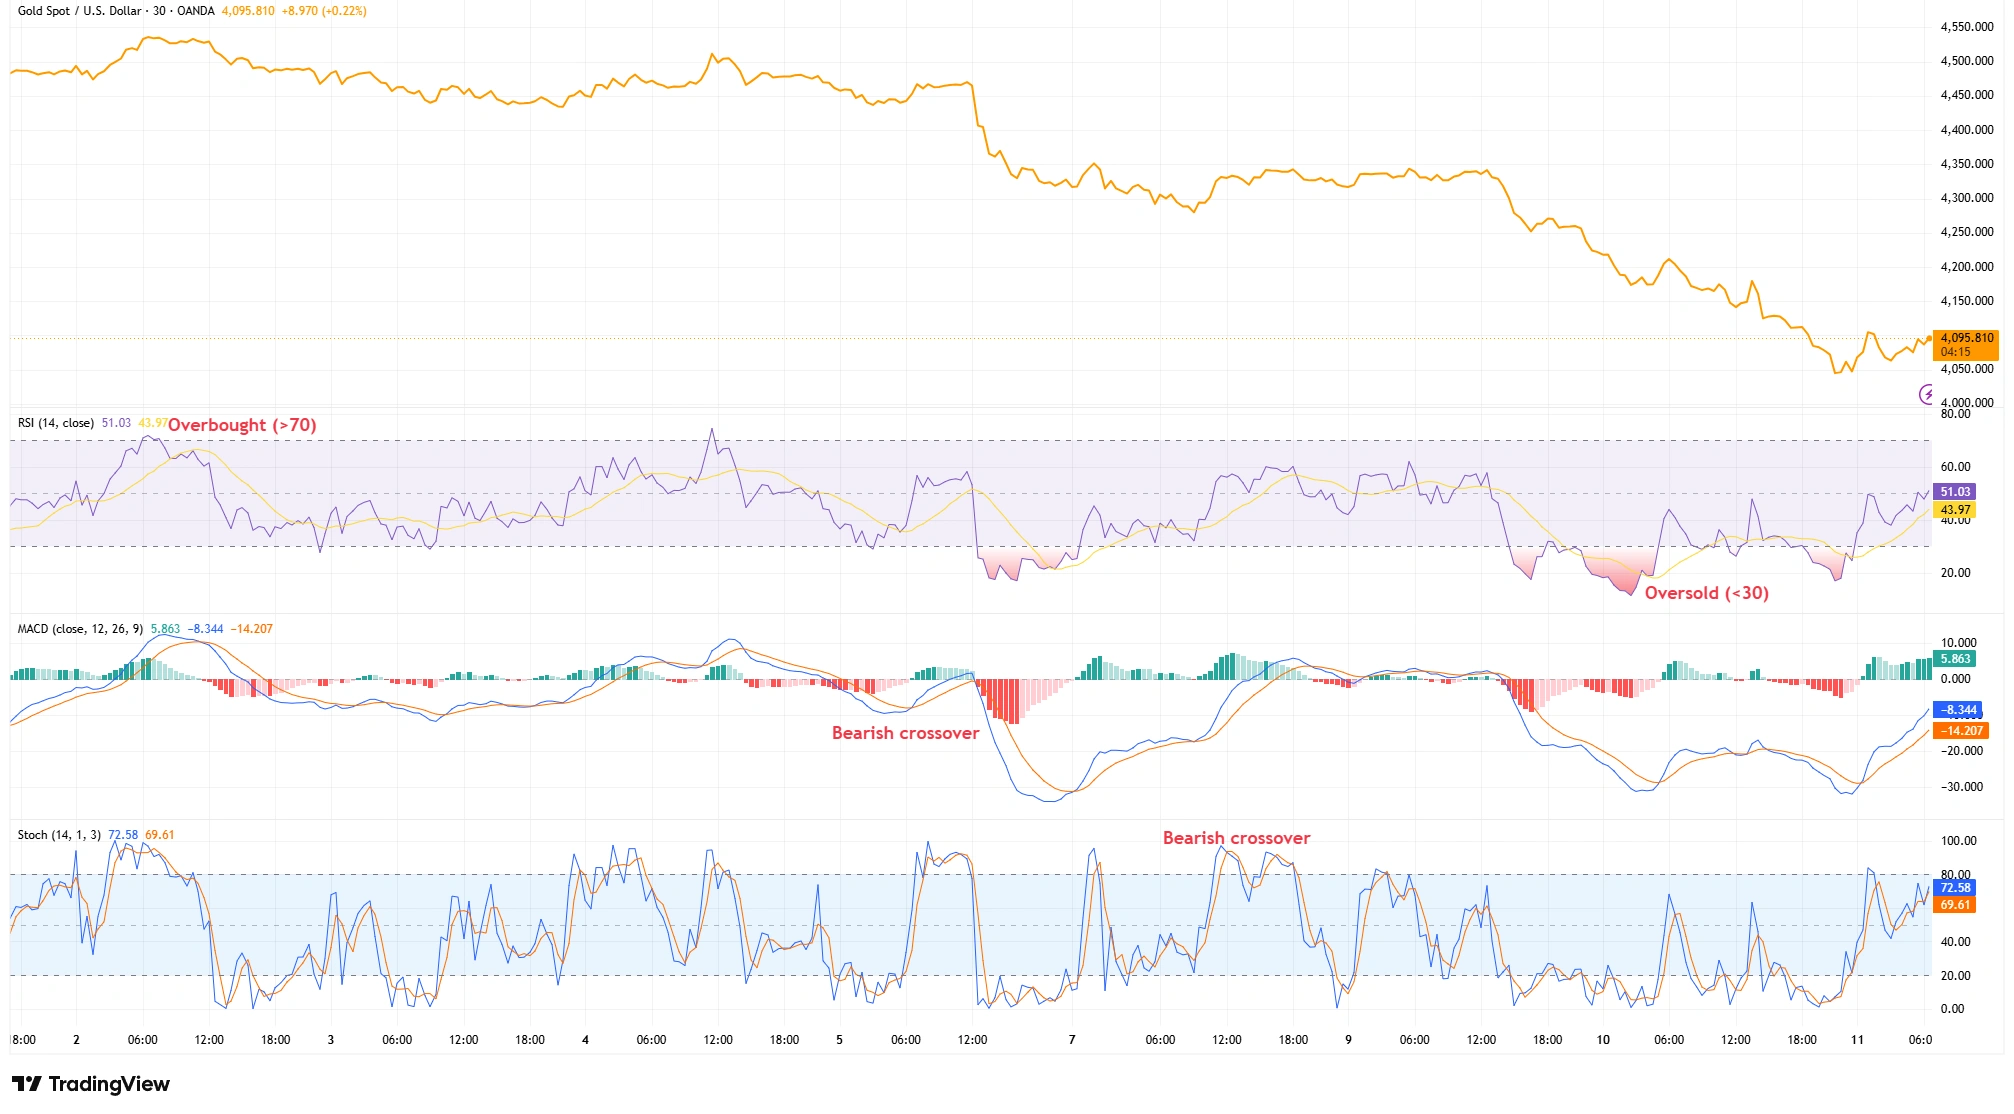
Sumber: TradingView. Kinerja masa lalu bukan indikator yang dapat diandalkan untuk kinerja di masa depan. Data per 11 Juni 2026.
Panel atas menampilkan harga emas, sedangkan tiga panel bawah menunjukkan bagaimana masing-masing indikator bereaksi terhadap perubahan kondisi pasar pada periode yang sama.
Jika melihat grafik lebih dekat, setiap indikator menyoroti aspek perilaku pasar yang berbeda.
Pada contoh Emas di atas, RSI bergerak ke wilayah overbought di atas 70 pada awal Juni sebelum kemudian mendekati level oversold saat penurunan berikutnya. Pembacaan ini menggambarkan periode ketika momentum menjadi sangat kuat ke satu arah.
Indikator MACD juga mengalami bearish crossover saat momentum turun menguat. Beberapa trader memantau crossover ini karena dapat memberikan wawasan tentang perubahan momentum tren, meskipun tidak menjamin pergerakan harga di masa depan.
Sementara itu, Stochastic Oscillator bereaksi lebih cepat terhadap pergerakan harga jangka pendek, berulang kali bergerak antara wilayah overbought dan oversold. Sensitivitas yang lebih tinggi ini kadang menghasilkan lebih banyak sinyal dibandingkan RSI, terutama selama periode volatilitas meningkat.
Satu hal penting yang dapat diamati adalah indikator-indikator tersebut tidak selalu bergerak secara selaras. Terkadang, satu indikator menunjukkan momentum mulai melemah sementara indikator lain masih menunjukkan kekuatan yang berlanjut.
Grafik ini juga mengilustrasikan mengapa banyak trader menggabungkan beberapa indikator dan bentuk analisis lain, bukan hanya mengandalkan satu sinyal saja.
Mengapa Indikator Bisa Memberikan Sinyal Berbeda?
Karena setiap indikator mengukur aspek perilaku pasar yang berbeda, sangat wajar jika mereka tidak selalu sejalan.
Misalnya, RSI mungkin menunjukkan pasar sudah overbought sementara MACD masih menunjukkan momentum yang kuat. Demikian pula, Stochastic Oscillator bisa masuk ke wilayah oversold sementara harga masih terus turun.
Perbedaan ini tidak selalu berarti satu indikator benar dan yang lain salah. Pasar itu kompleks, dan setiap indikator memberikan sudut pandang berbeda tentang apa yang terjadi di balik pergerakan harga.
Apakah Indikator Selalu Berfungsi?
Tidak.
Indikator teknikal adalah alat diagnostik, bukan jaminan.
Pasar terus-menerus dipengaruhi oleh data ekonomi, laporan laba perusahaan, keputusan bank sentral, dan perubahan sentimen investor. Karena itu, indikator terkadang dapat memberikan informasi yang saling bertentangan.
Misalnya, RSI mungkin menunjukkan pasar sudah overbought sementara MACD tetap bullish. Demikian pula, Stochastic Oscillator dapat menghasilkan sinyal pembalikan yang cepat menghilang jika harga terus bergerak kuat ke arah yang sama.
Sinyal palsu adalah bagian normal dari analisis teknikal, itulah sebabnya trader berpengalaman jarang hanya mengandalkan satu indikator saja.
Memahami indikator teknikal adalah latihan probabilitas, bukan kepastian.
Bagaimana Trader Menggunakan Indikator?
Kebanyakan trader tidak menggunakan indikator secara terpisah. Sebaliknya, mereka menggabungkannya dengan bentuk analisis lain untuk membangun pemahaman yang lebih luas tentang kondisi pasar.
Mereka dapat menggabungkan indikator dengan:
- Zona support dan resistance horizontal
- Trendline dan channel untuk memantau arah pasar secara umum
- Pola candlestick yang memberikan wawasan tentang perilaku harga jangka pendek
- Analisis fundamental yang melacak kondisi ekonomi secara luas
Menggunakan beberapa alat secara bersamaan membantu trader menghindari ketergantungan berlebihan pada satu sinyal saja.
Tidak ada indikator yang bekerja secara sempurna, dan manajemen risiko yang disiplin tetap menjadi bagian penting dari setiap strategi trading.
Tidak ada juga indikator yang secara universal “terbaik”. Setiap trader memiliki preferensi berbeda, dan alat yang digunakan sering kali bergantung pada tujuan, jangka waktu, dan gaya trading mereka.
Kesimpulan
Indikator teknikal membantu trader menganalisis momentum, kekuatan tren, dan perubahan kondisi pasar.
RSI, MACD, dan Stochastic Oscillator masing-masing mengukur aspek perilaku harga yang berbeda, itulah sebabnya banyak trader menggunakannya secara bersamaan daripada hanya mengandalkan satu sinyal.
Meskipun indikator tidak dapat memprediksi pergerakan harga di masa depan, indikator dapat memberikan konteks yang berharga jika dikombinasikan dengan support dan resistance, analisis tren, dan manajemen risiko yang baik.
Tujuannya bukan untuk menemukan indikator yang sempurna, melainkan mengembangkan kerangka kerja yang konsisten untuk menginterpretasikan perilaku pasar dan membuat keputusan trading yang lebih terinformasi.