EUR/USD has quietly become one of 2025’s cleanest technical charts. From a January base near 1.08 to recent highs above 1.14, the euro has gained ground on the back of a softer US dollar and growing speculation that the Fed may start cutting rates. But even in this rally, the pair hasn’t moved in a straight line.
Instead, it’s bounced off clear zones on the chart – areas where price repeatedly pauses or reverses. These are known as support and resistance levels, and they’re helping traders figure out what might happen next.
EUR/USD in 2025: What the Chart Shows
From late February to mid-April, EUR/USD surged, peaking just under 1.1500. The move was driven by softening US inflation, which prompted expectations of Fed rate cuts, and relatively stable eurozone data. In May, the pair pulled back toward the 1.1180–1.1200 zone amid renewed eurozone growth concerns and profit-taking. As of early June, it has bounced back near 1.1390, reflecting a balance between easing US rate expectations and cautious optimism about Europe.
These turning points aren’t random – they show how traders react to shifting economic signals, buying when the euro looks undervalued (support), or selling when risks arise (resistance).
Key Resistance Zones
1.1450–1.1500: This zone halted the rally in late April and early May. As a big round number, 1.1500 often acts as a psychological ceiling. By that time, much of the optimism around a weaker US dollar was already priced in, while eurozone data – including softening manufacturing PMIs – added caution. The change in market sentiment led to increased selling activity. A strong break and close above 1.1500 would signal renewed buyer confidence and could pave the way toward the next target at 1.1600.
1.1410–1.1430: The softer resistance zone developed in late May when EUR/USD tried to bounce back. The price failed to maintain its position above 1.1430 which showed that buyers were uncertain. One reason? The Fed delivered conflicting signals about interest rates because some officials wanted to stop raising rates, but others maintained the possibility of additional increases. The market uncertainty led traders to decrease their bullish positions near resistance levels. The indecision of traders allowed sellers to strengthen the 1.1430 resistance level.
Key Support Zones
1.1180–1.1200: This zone acted like a safety net throughout May. Multiple dips were quickly bought up, suggesting buyers saw value here. Around this time, softer US inflation cooled rate hike fears and weakened the dollar, while the ECB’s cautious stance helped support the euro. Technically, this became a demand zone where buyers anticipated another move higher.
If EUR/USD retests and holds this level, it would reaffirm bullish control. A clean break below, however, could shake sentiment and trigger further downside.
1.1070–1.1100: This is a key support level where price consolidated in March before the rally. EUR/USD’s pause here earlier reflected indecision amid mixed economic signals from both sides of the Atlantic. It now acts as a fallback if the uptrend falters.
A decisive break below 1.1070 – especially alongside strong US data or renewed dollar strength – could signal a trend shift and put bulls on the defensive.
What the Indicators Say
- Moving Averages: Moving averages help smooth out price trends over time – they’re like “trend spotters.”
The 50-day moving average, currently around 1.123, is sloping upward. This means recent prices have been rising overall. When the current price stays above this line, it’s generally seen as a bullish signal, suggesting that momentum is on the upside. It also acts like a dynamic support line – a level where buyers tend to step in during short-term pullbacks.
The 200-day moving average, near 1.082, is flatter. This longer-term indicator reflects a broader sideways market that’s starting to tilt bullish. If EUR/USD stays above both lines, it signals a strengthening trend that could carry on if macroeconomic conditions support it.
EUR/USD Technical Setup: Support, Resistance, Moving Averages & RSI (2025 YTD)
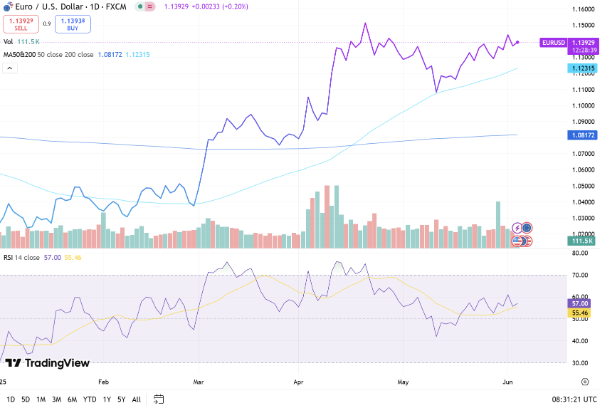
Source: TradingView. All indices are total return in US dollars. Past performance is not a reliable indicator of future performance. Data as of 3 June 2025.
- RSI (Relative Strength Index): With RSI close to 57, the EUR/USD pair is in a neutral territory. That tells us the pair isn’t stretched too far in either direction – there’s room for it to rise or fall depending on the next big catalyst (like US jobs data or ECB guidance).
It’s a sign that the market is balanced but alert – ready to follow the next clear signal.
What Traders Should Watch Next
Fundamentals still favour the euro: inflation in the eurozone is cooling but steady, while the US is facing more uncertainty around rate policy. EUR/USD has been holding above both moving averages – a positive sign – but it’s also struggling to break new highs.
Here’s what matters next:
- A break and close above 1.1500 could open the door for more upside.
- A drop below 1.1180 might signal that buyers are losing control.
Until then, traders are likely to respect the range between these levels.
Bottom Line
In 2025, EUR/USD has followed support and resistance zones with surprising precision. These levels show where traders are stepping in – and they’re often more reliable than any headline.
Right now, price is holding above trendlines and in the upper half of the range. But whether it breaks out or pulls back, the chart is already telling the story.
The smartest move? Keep your eyes on the zones – and let the price lead the way.
For more FX analysis and trading insights, keep following EC Markets.