Bitcoin remains prominent in the market at $96,550 after achieving significant price growth throughout the week. Investors closely observe the current momentum to determine if it will persist or if the market will experience a pullback. We need to examine the technical indicators to understand potential future market movements.
Big Picture: Why This Level Matters
Bitcoin has rebounded from its $95,000 support level and is now approaching the $98,000 resistance zone. These levels aren’t just random. Support and resistance act like invisible walls – they tell us where buyers and sellers tend to step in. If Bitcoin breaks above $98,000 with conviction, we could see a move toward the psychological level of $100,000. If it fails, a pullback to the $92,000-$95,000 area is possible.
Bitcoin: YTD Price (Jan to May 2025)
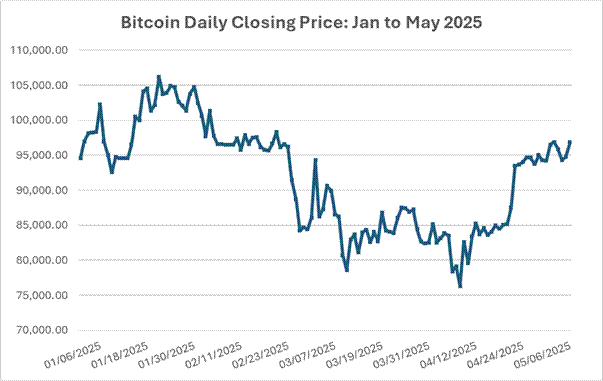
Source: Investing.com. All indices are total return in US dollars. Past performance is not a reliable indicator of future performance. Data as of 6 May 2025.
Recap of What’s Driving the Move
- ETF Inflows: Bitcoin ETFs pulled in $425 million this week alone with BlackRock having the majority inflows (over 80%), showing strong institutional demand. More institutions entering the space typically adds price support and reduces volatility.
- US-China Trade Optimism: The growing optimism about US-China relations helps to reduce market-wide concerns. This creates a more risk-on environment – good news for crypto.
- Metaplanet’s Bitcoin Buy: A major Japanese firm recently increased its Bitcoin exposure significantly, highlighting continued institutional accumulation despite volatility.
Support and Resistance Levels to Watch
- Support Levels: $95,000 and $92,500
- Resistance Levels: $98,000 and $100,000
Think of support as a floor – it's the price level where buyers typically step in, preventing the price from falling further. The current Bitcoin floor price exists between $95,000 and $92,500. The market has shown recovery at these specific price points in the past.
Resistance, on the other hand, acts like a ceiling – it’s where selling pressure increases and the price struggles to break through. The two critical resistance points for Bitcoin exist at $98,000 and at the $100,000 psychological threshold.
The price movement occurs within a trading range that consists of these four specific levels. Strong buying activity (volume) that enables Bitcoin to surpass $98,000 could attract momentum traders who might drive the price up to $100,000 and higher. A price drop below support levels indicates decreasing market demand which might result in a more significant market correction.
Understanding these levels helps traders plan their entries, exits, and stop-losses more strategically – instead of guessing where prices might go.
Key Technical Indicators
- MACD (Moving Average Convergence Divergence):
The blue MACD line has crossed below the orange signal line on May 5th which typically indicates decreasing market momentum. The indicator does not predict price drops, but it suggests Bitcoin's upward momentum could be weakening. The chart shows increasing red bars which indicate that negative market pressure is intensifying. Traders use this pattern to determine their next steps between caution and waiting for more definitive signals before making a purchase.
Bitcoin: MACD Indicator (Snapshot as of 5 May 2025)
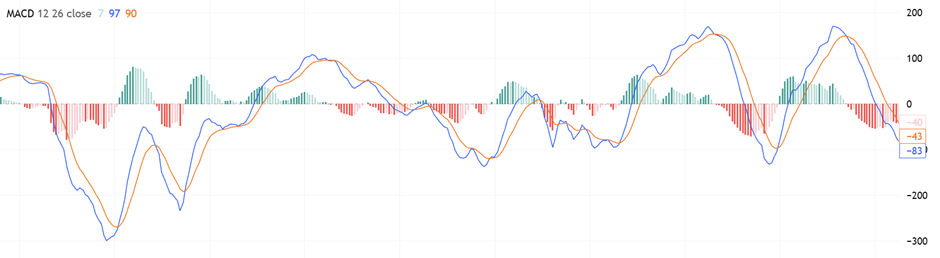
Source: Tradingview .com. All indices are total return in US dollars. Past performance is not a reliable indicator of future performance. Data as of 5 May 2025.
- RSI (Relative Strength Index):
The RSI measures whether an asset like Bitcoin is overbought or oversold. It ranges from 0 to 100. Right now, it’s around 54 – which is considered neutral. That means Bitcoin isn’t too hot or too cold. If it moves above 60, it could signal growing buying strength. If it rises past 70, it could mean the price is overheating and due for a pullback. - Volume Trends:
One concern is that recent gains have come on declining volume. For a breakout to be sustainable, volume typically needs to rise – showing that more traders are stepping in. Rising prices on falling volume can be a red flag – it suggests fewer buyers are supporting the move.
Caution: Don’t Get Caught in a Bull Trap
Short-term traders need to exercise caution because the path to $100K does not appear straightforward. The previous Bitcoin all-time high reached $69,000 which makes this current move particularly important. Bitcoin will likely stay within a defined range or experience a short-term decline unless it breaks through $98K with strong market volume and rising RSI.
This type of "bull trap" situation emerges when prices seem to break out before reversing direction suddenly which surprises investors who bought in.
Market Sentiment: Greed Rising
The Crypto Fear & Greed Index is currently sitting around 67, indicating confidence building and rising prices. While this shows improving sentiment, it’s also a warning sign. Extreme greed can lead to overheated markets – and eventual corrections.
Bottom Line: Watch These Next Moves
Bitcoin’s current move looks promising, but confirmation is key. Traders should keep an eye on:
- A daily close above $98,000
- Rising trading volume
- RSI moving above 60
- MACD turning bullish again
If these conditions align, Bitcoin could be preparing for a fresh run toward all–time highs. If not, a pause or pullback would be healthy – and possibly a better entry point for long–term investors.
As always, remember: price action tells the story. It’s not about predicting the market. It’s about preparing for different outcomes and managing risk accordingly.
Stay tuned as we track this key moment in Bitcoin’s journey – and what it means for crypto markets overall.